Kubernetes Cluster 687,087687,087 5.0 (5 reviews)
Description
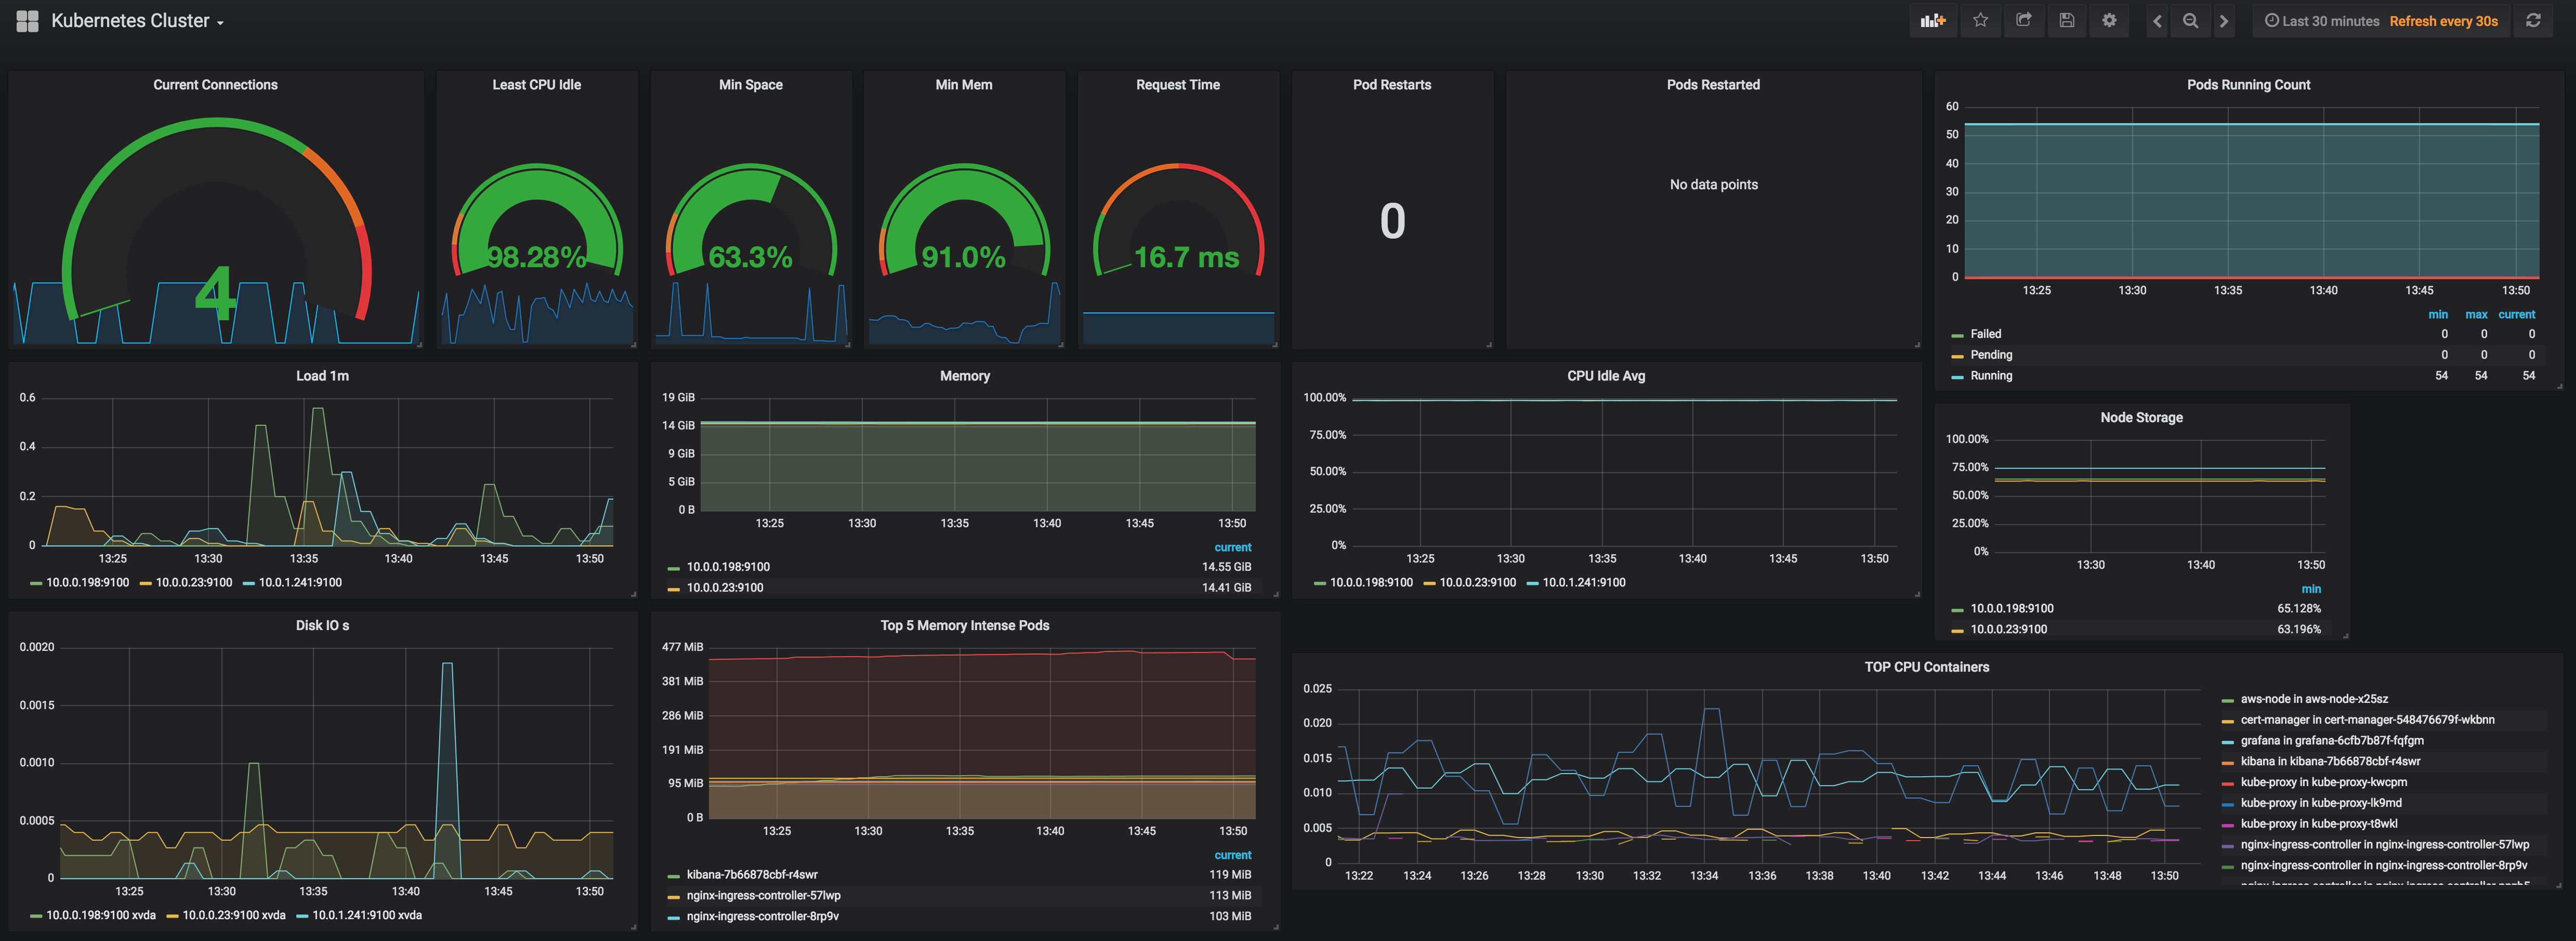
This dashboard monitors the health and resource usage of a Kubernetes cluster, aggregating node, pod, and container metrics to reveal operational bottlenecks. It highlights CPU and memory utilization, disk and filesystem capacity, and pod activity such as restarts and running counts to identify stability and performance issues. Key metrics include node_cpu_seconds_total, node_memory_MemAvailable_bytes, and kube_pod_container_status_restarts_total, along with panels for I/O, latency (http_request_duration_seconds_count), and PoD-level resource pressures like kubelet_running_pod_count and node_filesystem_avail_bytes.
Screenshots
Used Metrics 1818
-
container_cpu_usage_seconds_total
-
container_memory_usage_bytes
http_request_duration_seconds_count
kube_pod_container_status_restarts_total
kube_pod_status_phase
kubelet_running_pod_count
nginx_connections_total
-
node_cpu_seconds_total
-
node_disk_io_time_seconds_total
-
node_filesystem_avail_bytes
-
node_filesystem_size_bytes
-
node_load1
-
node_memory_Buffers_bytes
-
node_memory_Cached_bytes
-
node_memory_MemAvailable_bytes
-
node_memory_MemFree_bytes
-
node_memory_MemTotal_bytes
topk