Kubernetes cluster monitoring 3,7863,786
2/22/2018
3/12/2020
6
>=6.5.2
Prometheus
Description
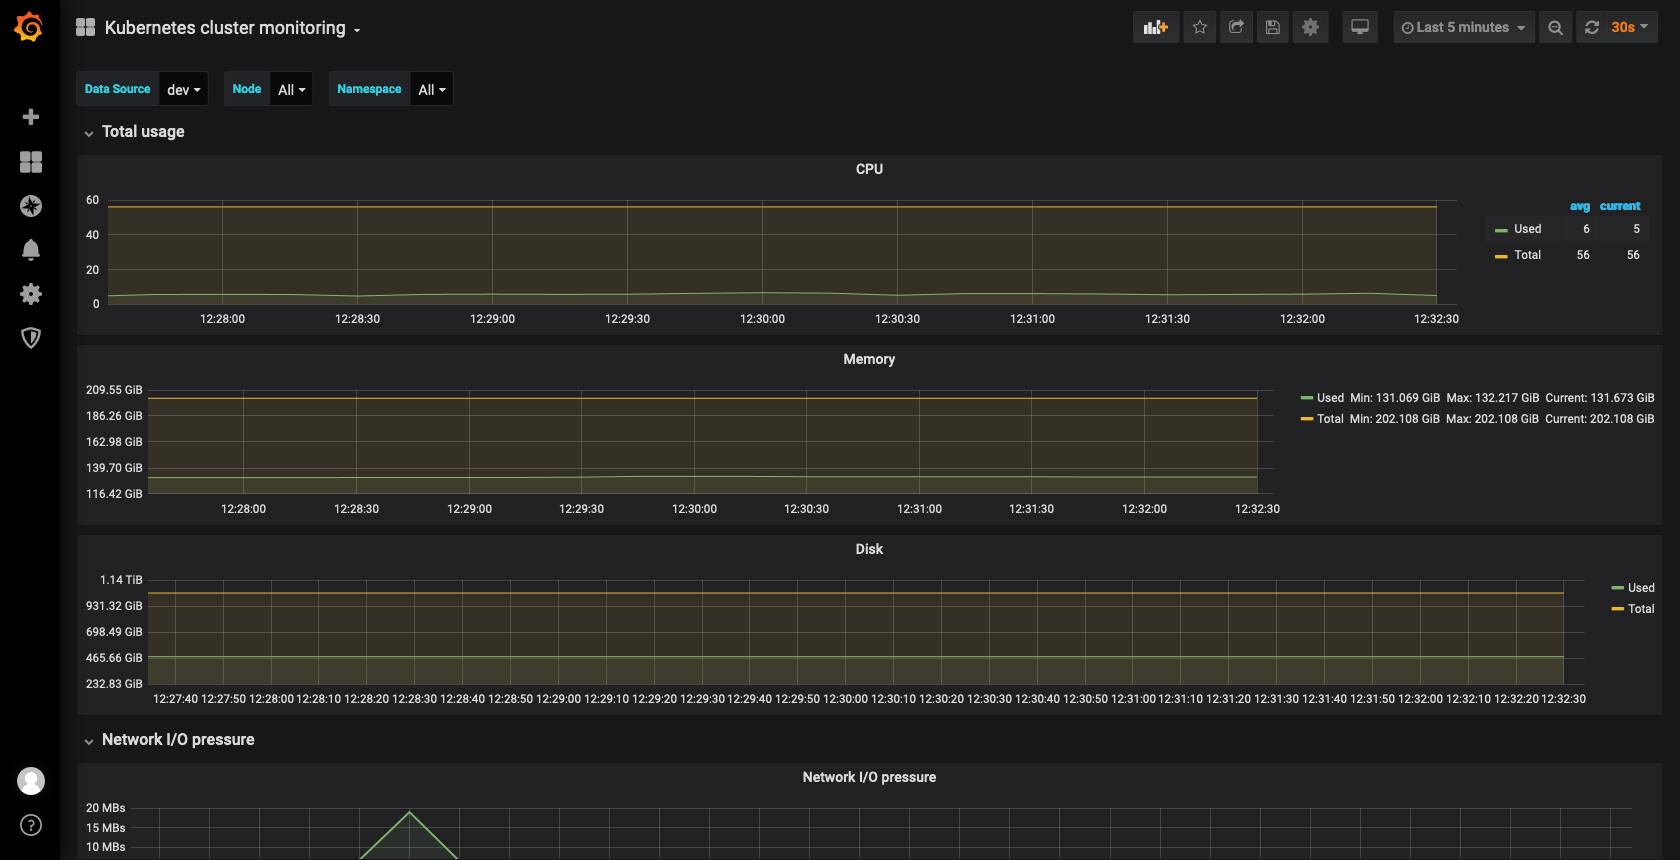
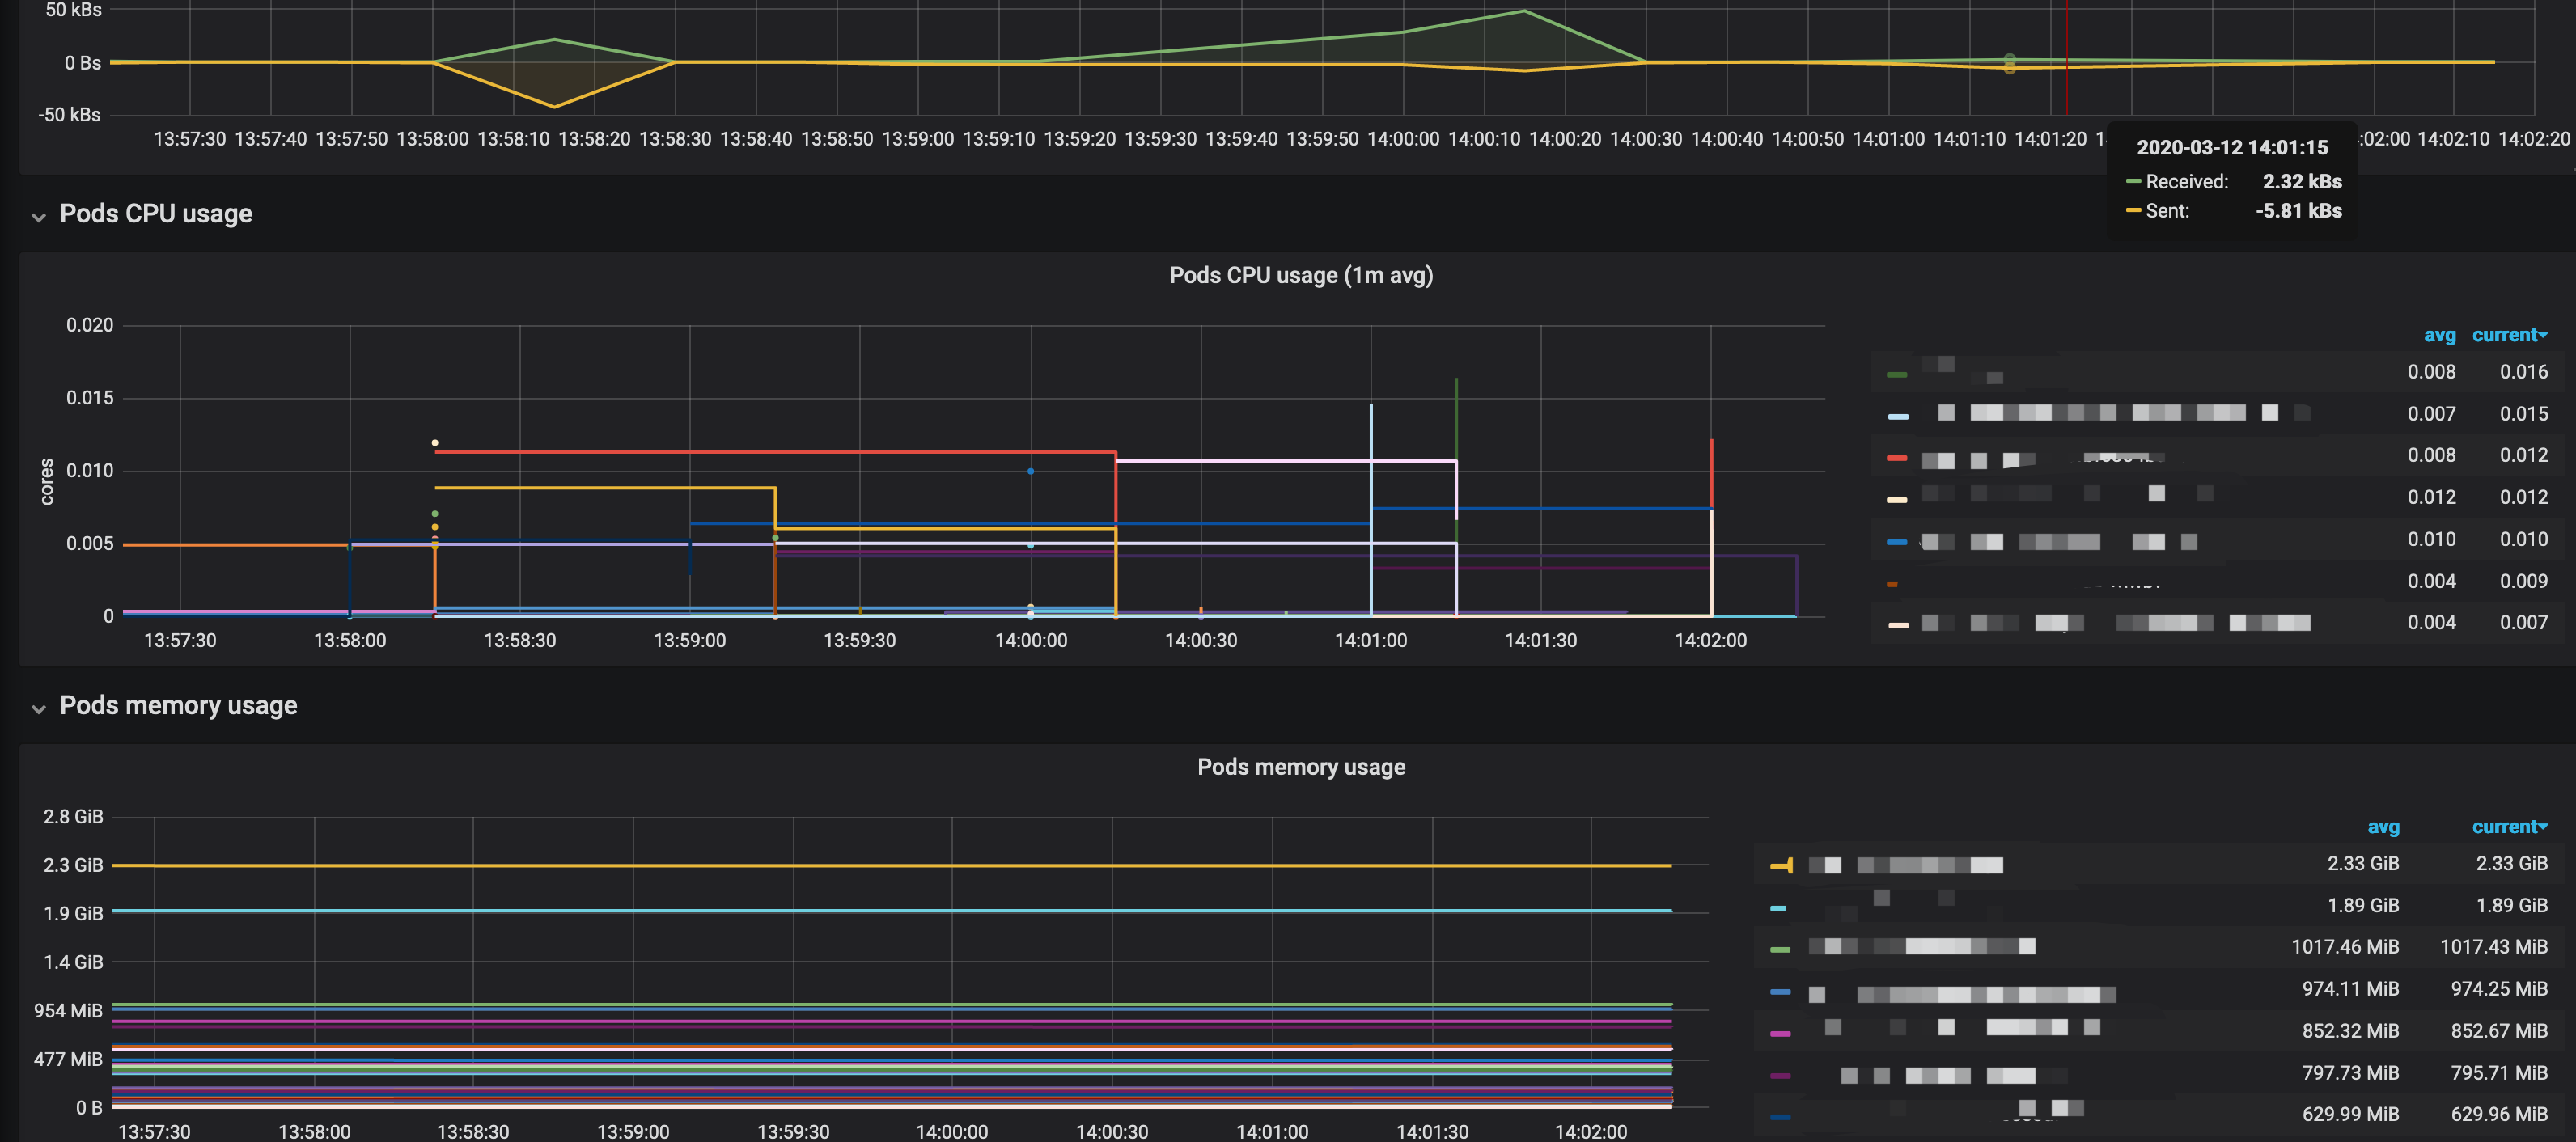
Monitors Kubernetes cluster using Prometheus. Shows overall cluster CPU / Memory / Filesystem usage as well as individual pod, containers, systemd services statistics. Uses cAdvisor metrics only.
Screenshots
Get Dashboard✕
Download
Copy to Clipboard