Kubernetes cluster monitoring (via Prometheus) 22,540,64622,540,646 4.4 (11 reviews)
8/13/2016
3/20/2023
3
DockerHost Metrics
>=3.1.1
Prometheus
Description
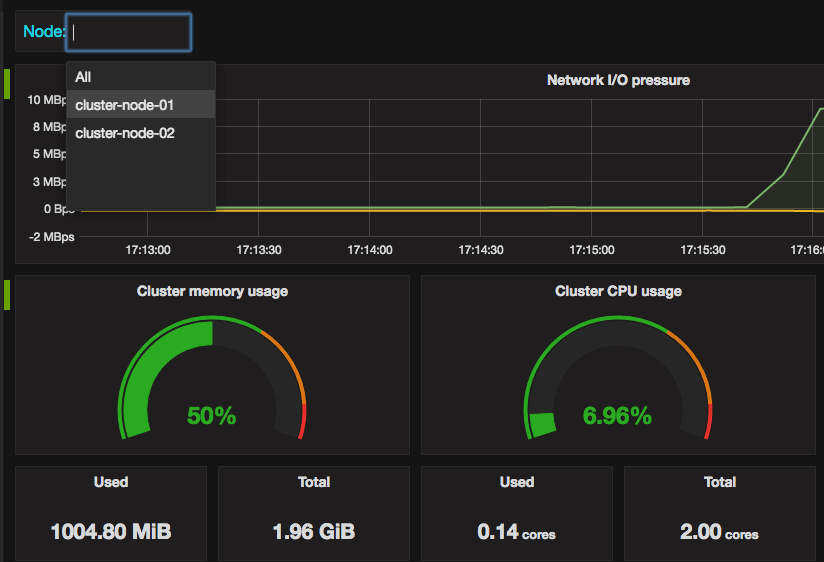
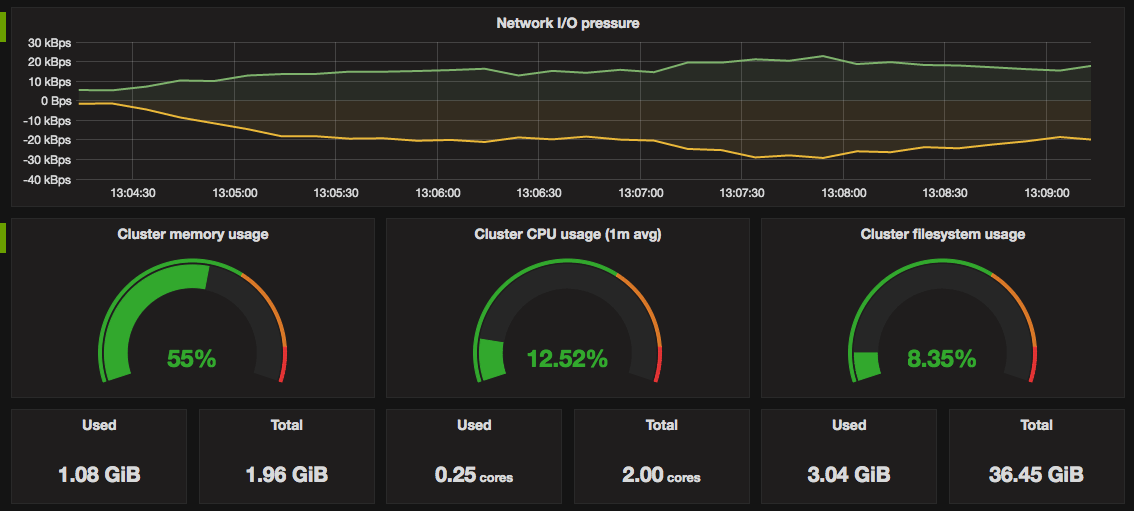
Monitors a Kubernetes cluster by aggregating Prometheus metrics to visualize node, pod, and workload health across the control plane and workloads. Key metrics include node_cpu_seconds_total (per-node CPU usage) and container_memory_usage_bytes (per-container memory consumption), with alerts and dashboards highlighting resource saturation, pod restarts, and node availability to quickly identify bottlenecks and failures.
Screenshots
Get Dashboard✕
Download
Copy to Clipboard