Kubernetes Dashboard 28,59928,599
3/15/2023
3/15/2023
1
Host Metrics
>=9.1.0
Prometheus
Description
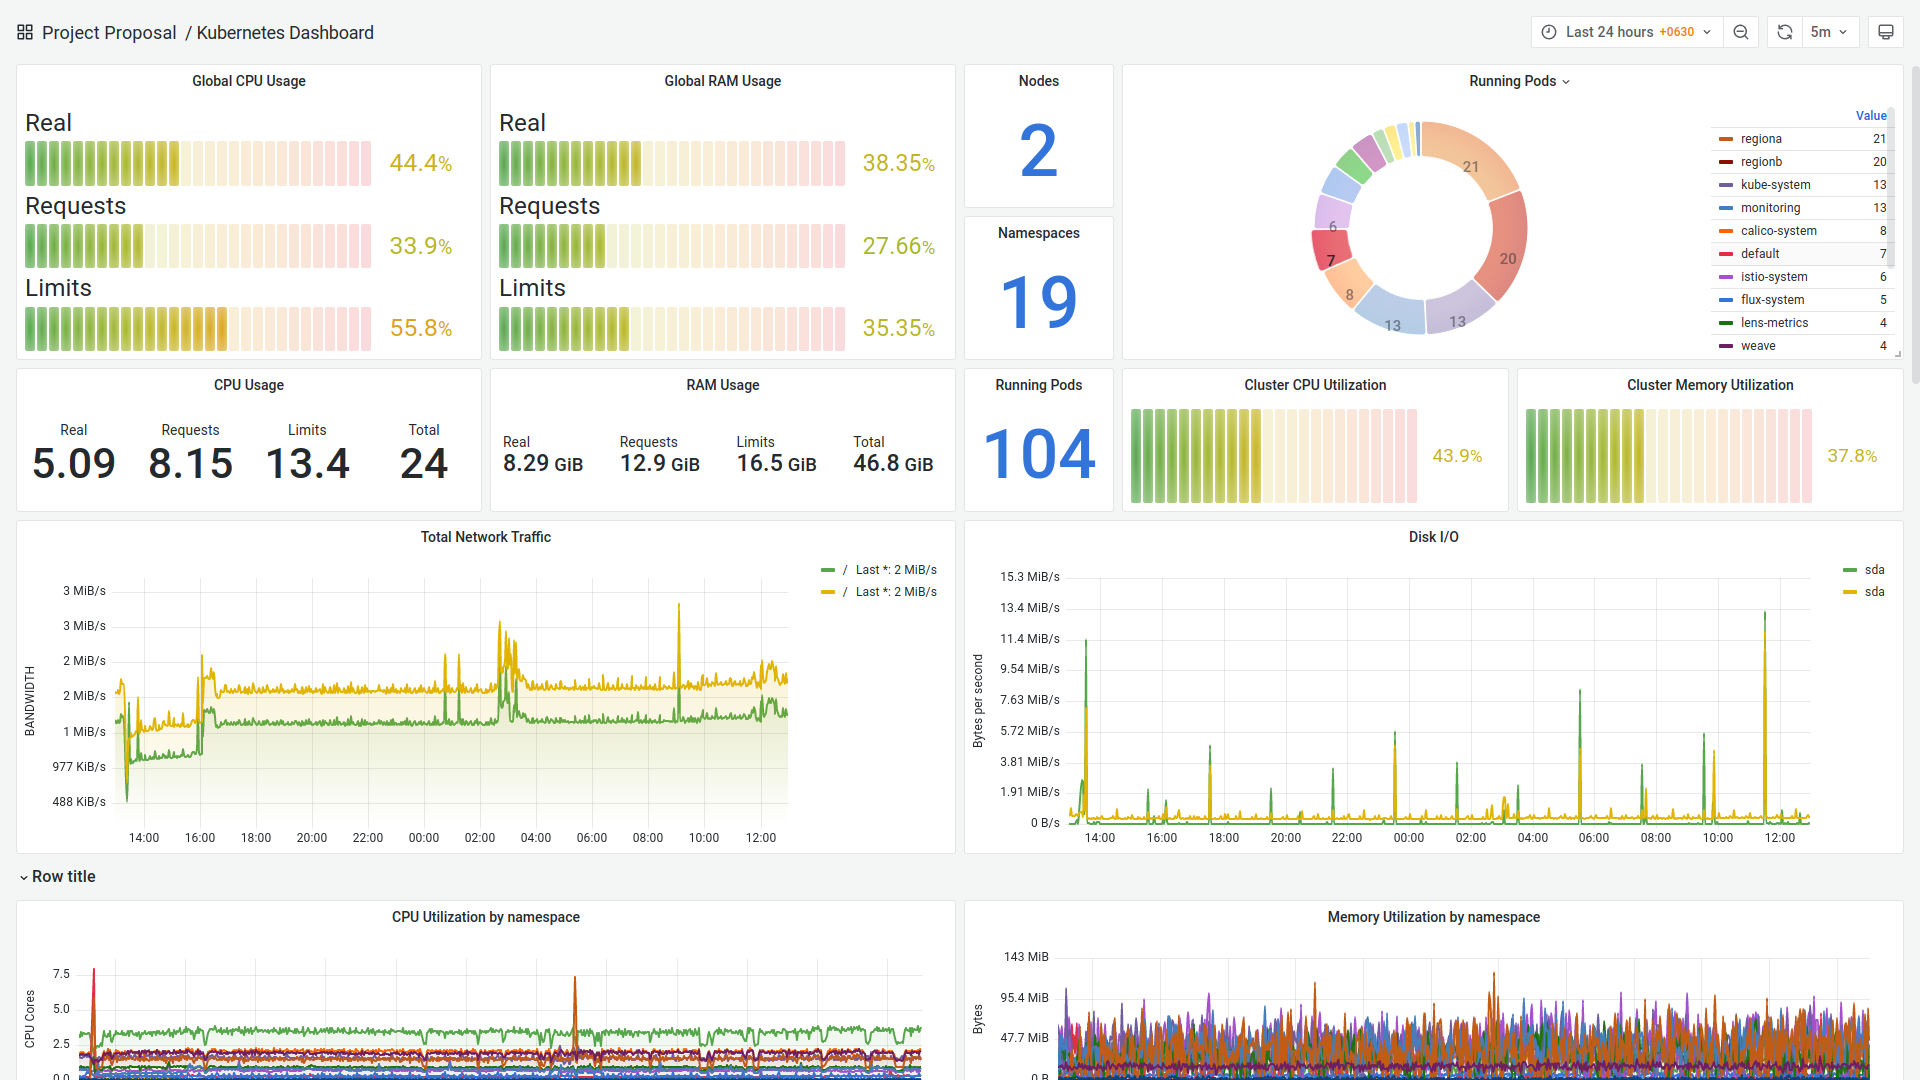
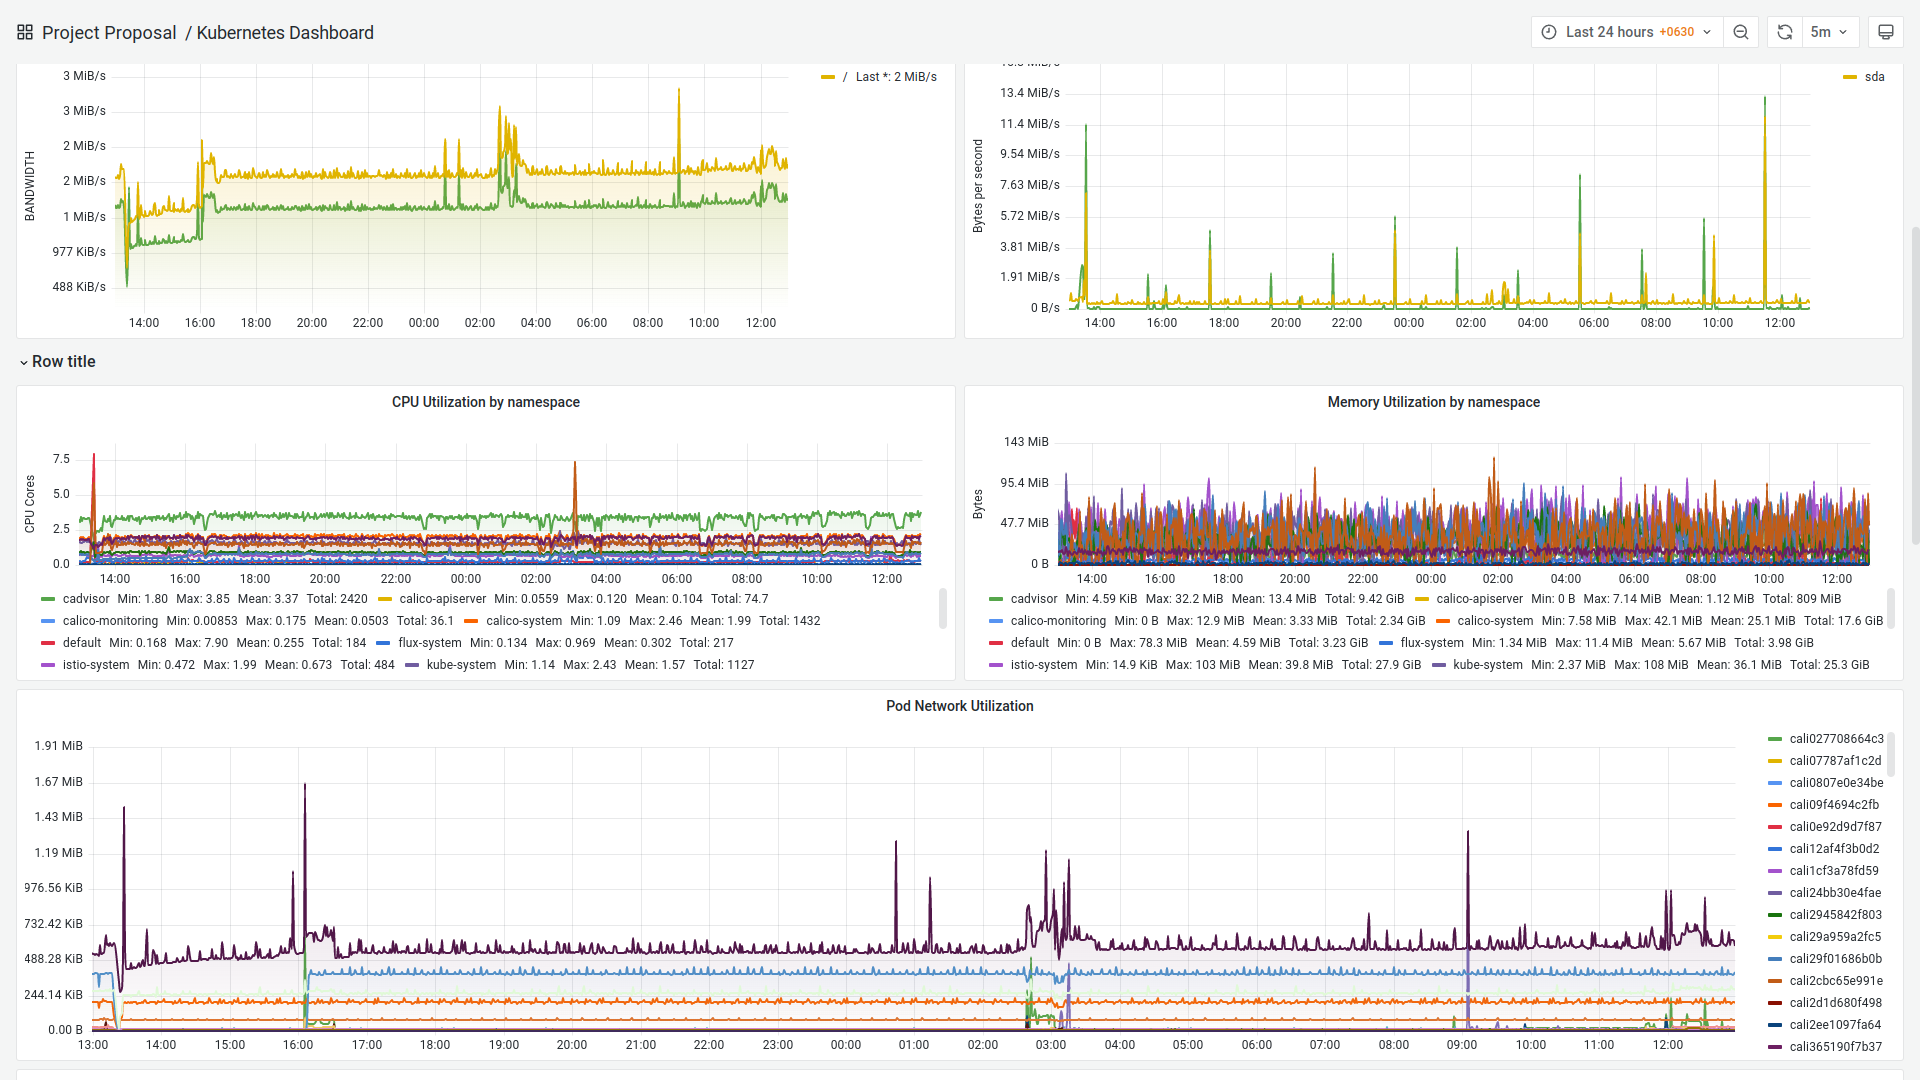
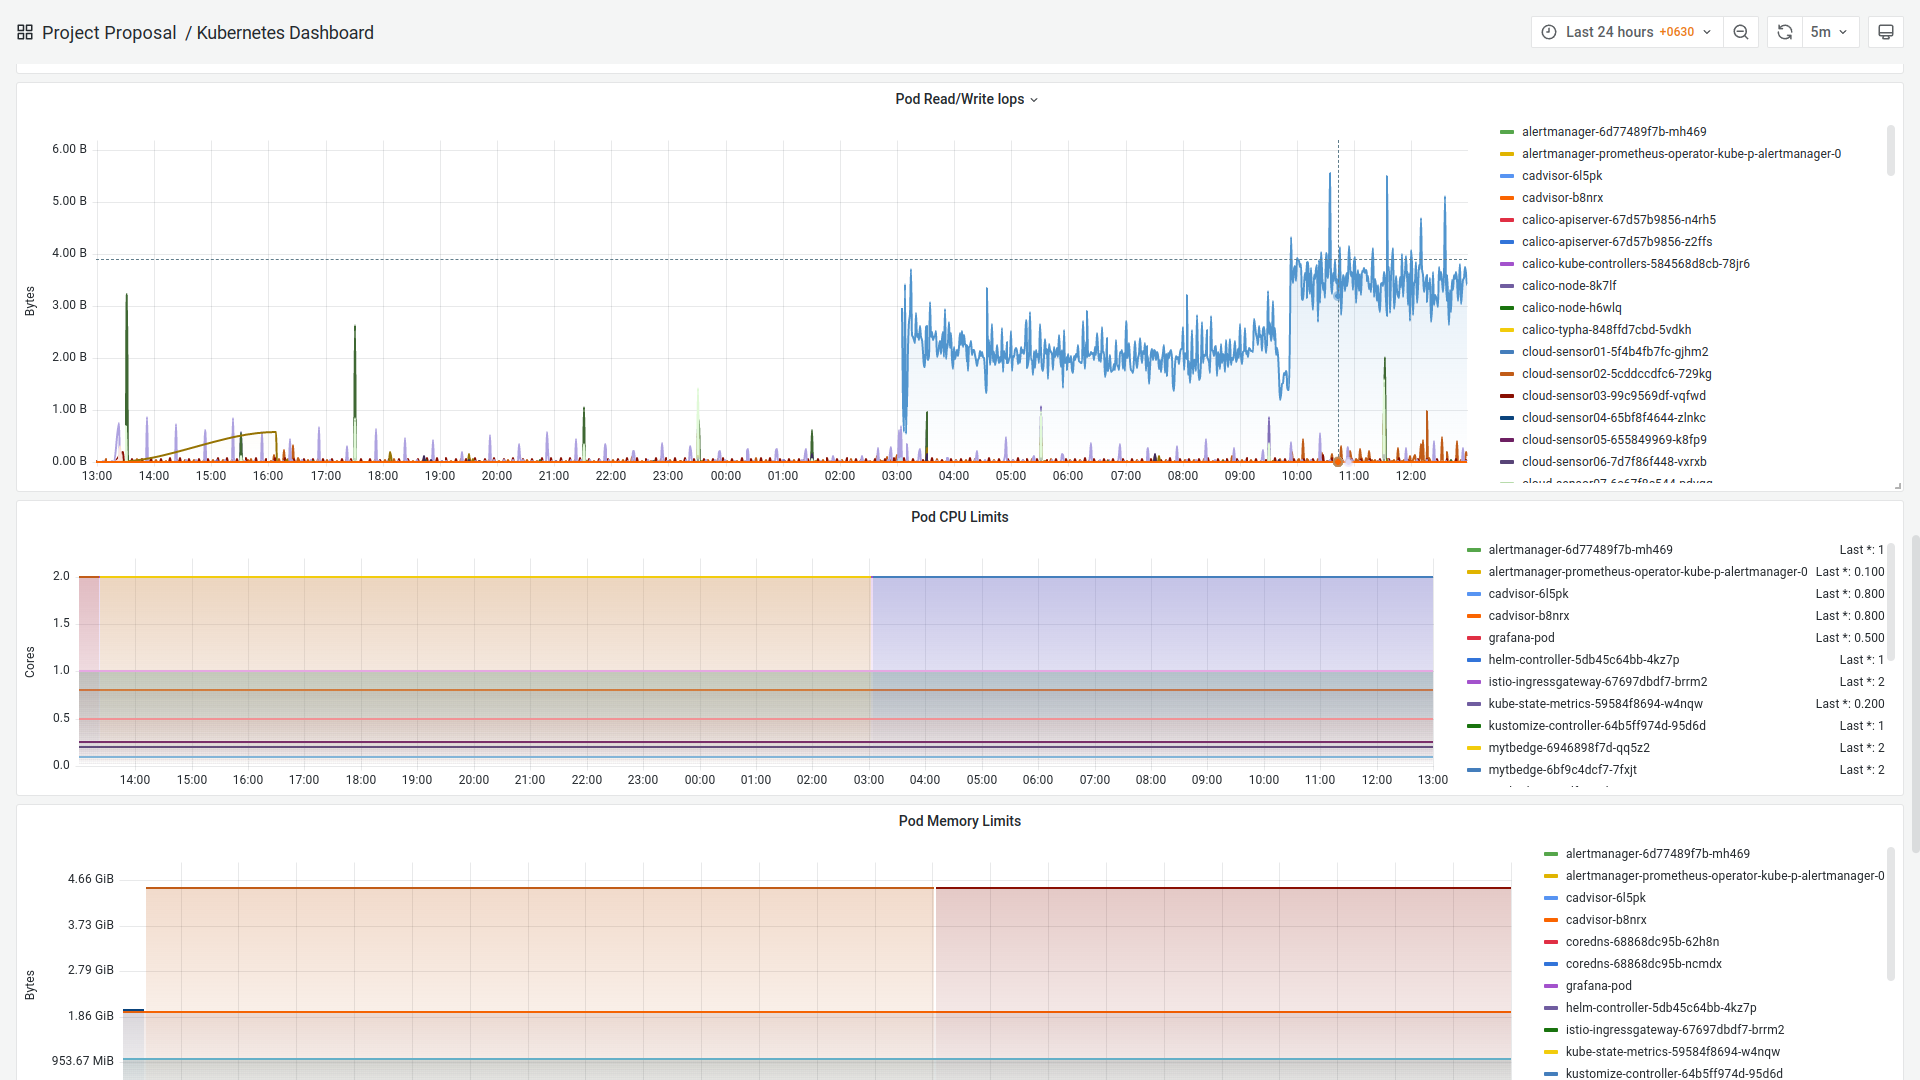
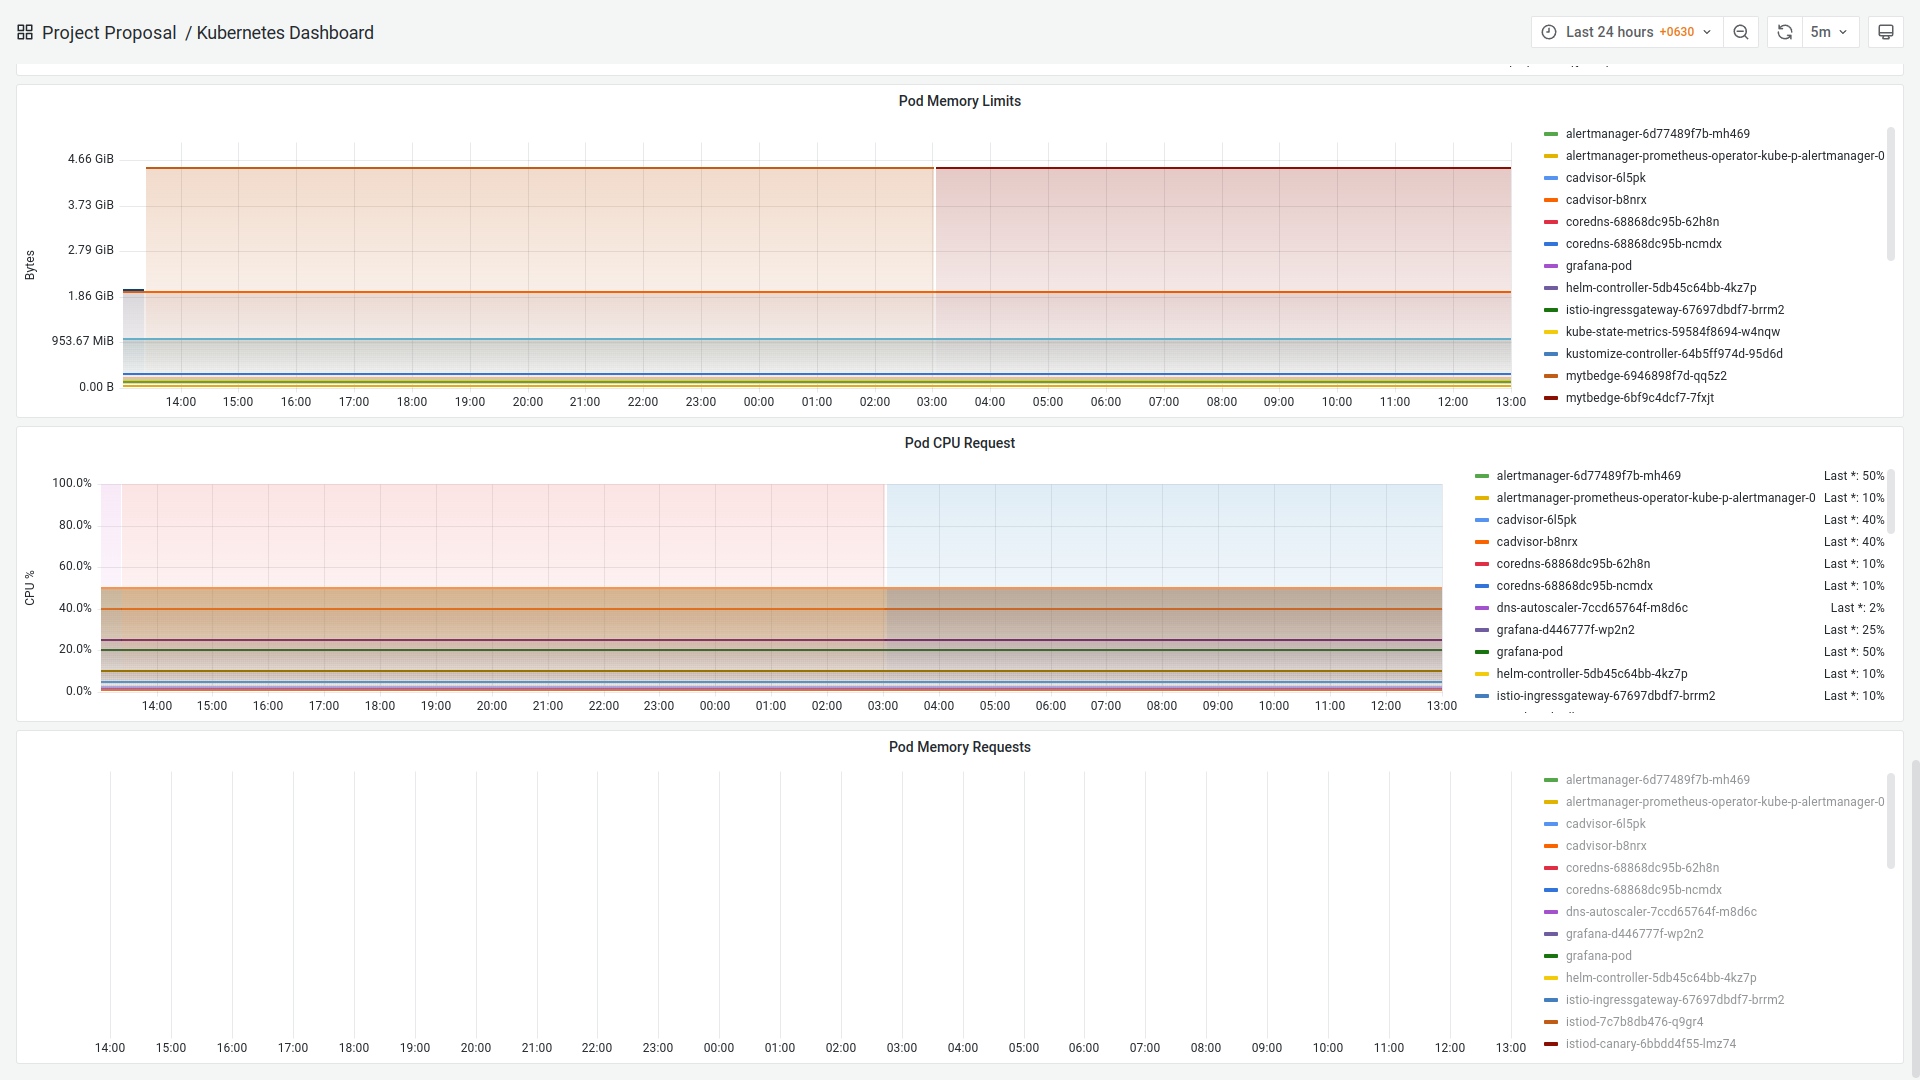
to monitor pod cpu, memory, I/O, RX/TX and cluster cpu, memory request/limit/real usage, RX/TX, Disk I/O
Screenshots
Used Metrics 2020
-
container_cpu_usage_seconds_total
-
container_fs_writes_total
-
container_memory_working_set_bytes
-
container_network_receive_bytes_total
-
container_network_transmit_bytes_total
coredns_cache_entries
coredns_forward_requests_total
kube_namespace_created
kube_pod_container_resource_limits
kube_pod_container_resource_requests
kube_pod_container_status_running
kube_pod_status_phase
-
machine_cpu_cores
-
machine_memory_bytes
-
node_cpu_seconds_total
-
node_disk_read_bytes_total
-
node_disk_written_bytes_total
-
node_memory_MemAvailable_bytes
-
node_memory_MemTotal_bytes
-
up
Get Dashboard✕
Download
Copy to Clipboard