Kubernetes Deployments 96,92196,921 5.0 (5 reviews)
Description
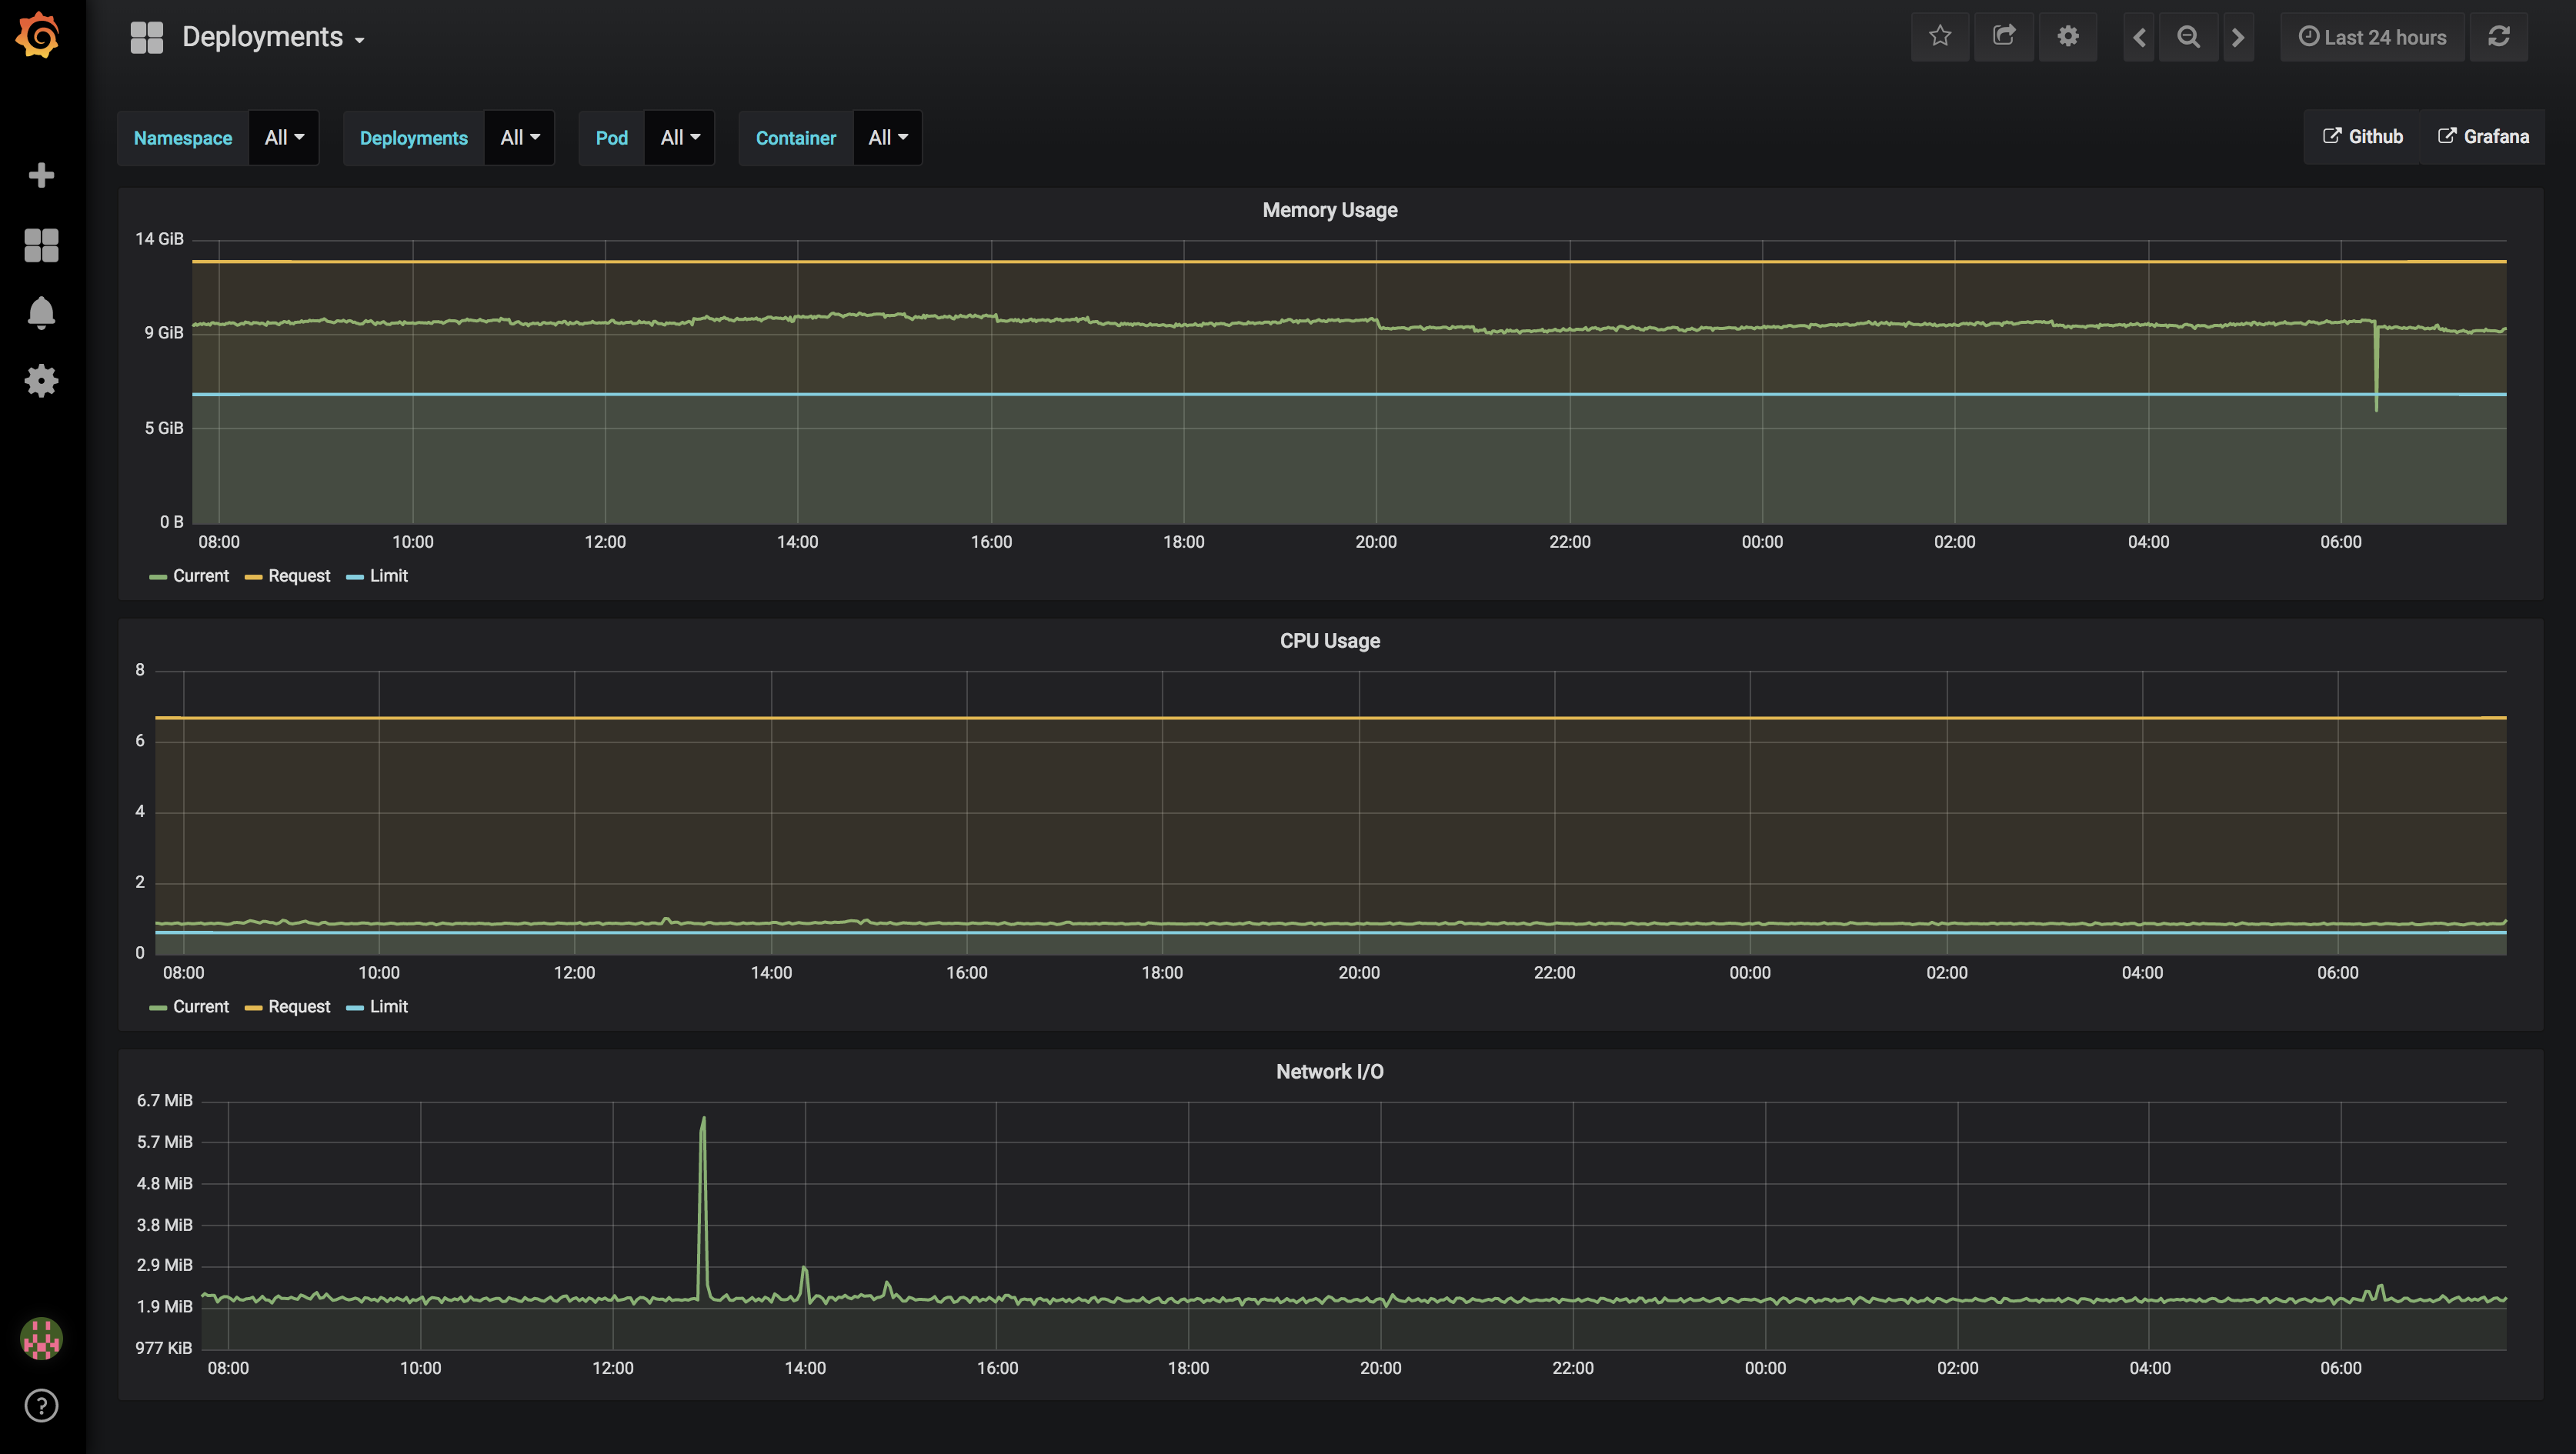
This dashboard monitors Kubernetes pod deployments by displaying resource utilization and networking activity across containers. It highlights memory usage with container_memory_usage_bytes, CPU usage via container_cpu_usage_seconds_total, and network I/O using container_network_receive_bytes_total, alongside resource requests and limits to assess capacity and potential bottlenecks. Overall, it enables quick identification of over- or under-provisioned containers and their throughput characteristics within the cluster.
Screenshots
Used Metrics 77
-
container_cpu_usage_seconds_total
-
container_memory_usage_bytes
-
container_network_receive_bytes_total
kube_pod_container_resource_limits_cpu_cores
kube_pod_container_resource_limits_memory_bytes
kube_pod_container_resource_requests_cpu_cores
kube_pod_container_resource_requests_memory_bytes