Kubernetes Loki logs 47,67547,675
9/15/2022
11/23/2025
3
AWSAzureDockerElasticsearchHost Metrics
>=12.3.0
LokiPrometheus
Description
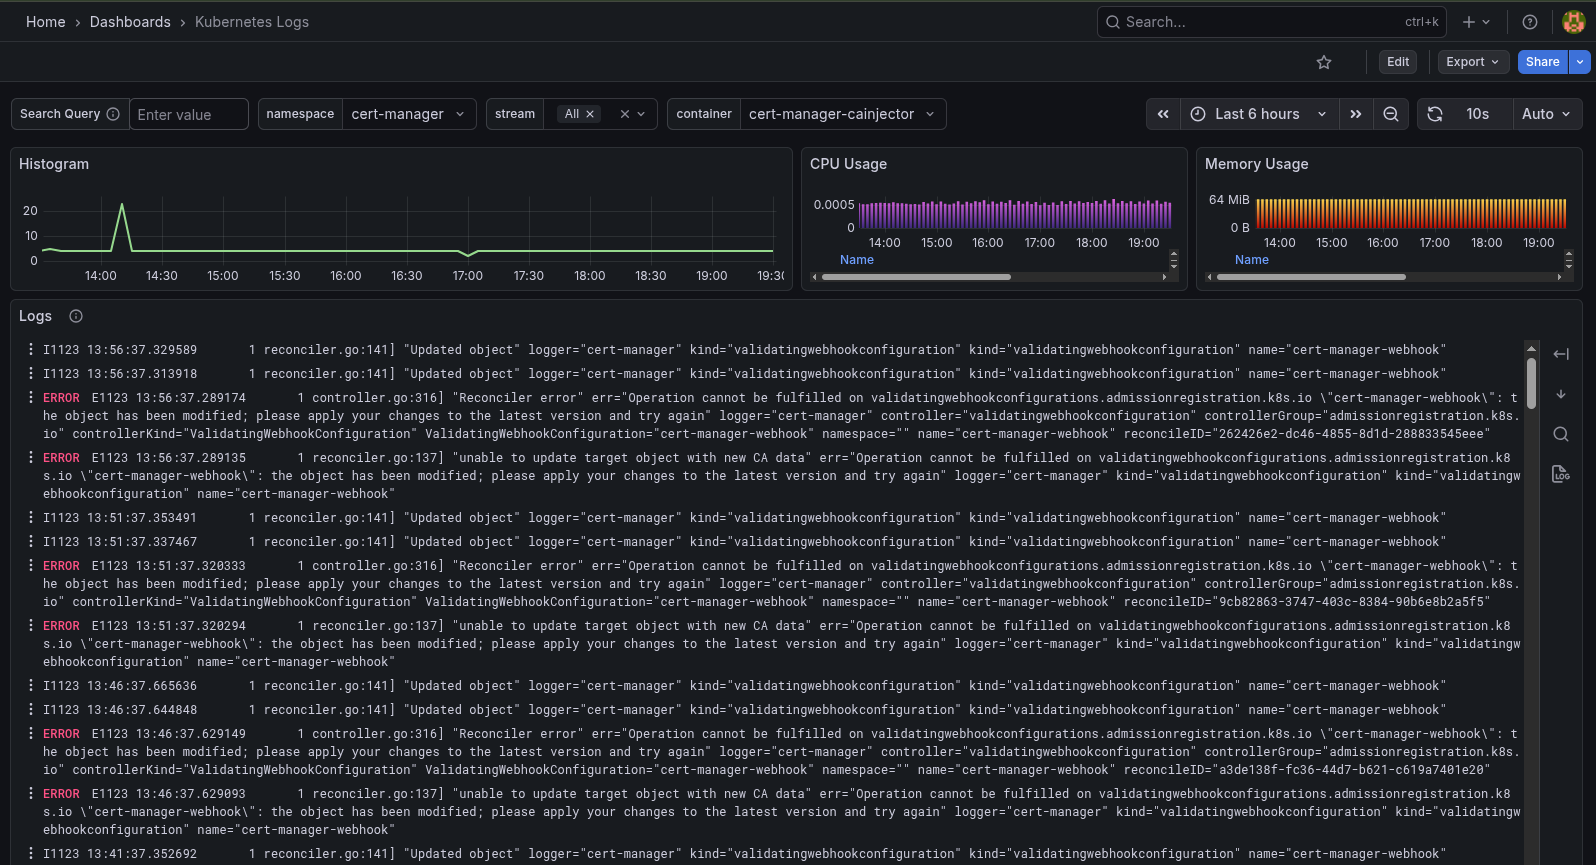
This dashboard monitors Kubernetes performance and log activity by combining Loki log data with Prometheus metrics. It highlights resource usage and pod state through metrics like container_cpu_usage_seconds_total and container_memory_working_set_bytes, alongside log-driven insights such as histogram-based event patterns and logs panels. Key features include CPU and memory usage heatmaps, pod lifecycle visibility via kube_pod_status_phase, and contextual workload attribution using workload, namespace_workload_pod:kube_pod_owner:relabel.
Screenshots
Used Metrics 77
-
container_cpu_usage_seconds_total
-
container_memory_working_set_bytes
i
kube_pod_status_phase
namespace_workload_pod:kube_pod_owner:relabel
query
workload
Get Dashboard✕
Download
Copy to Clipboard