Kubernetes Monitoring Overview 44,36044,360 5.0 (3 reviews)
Description
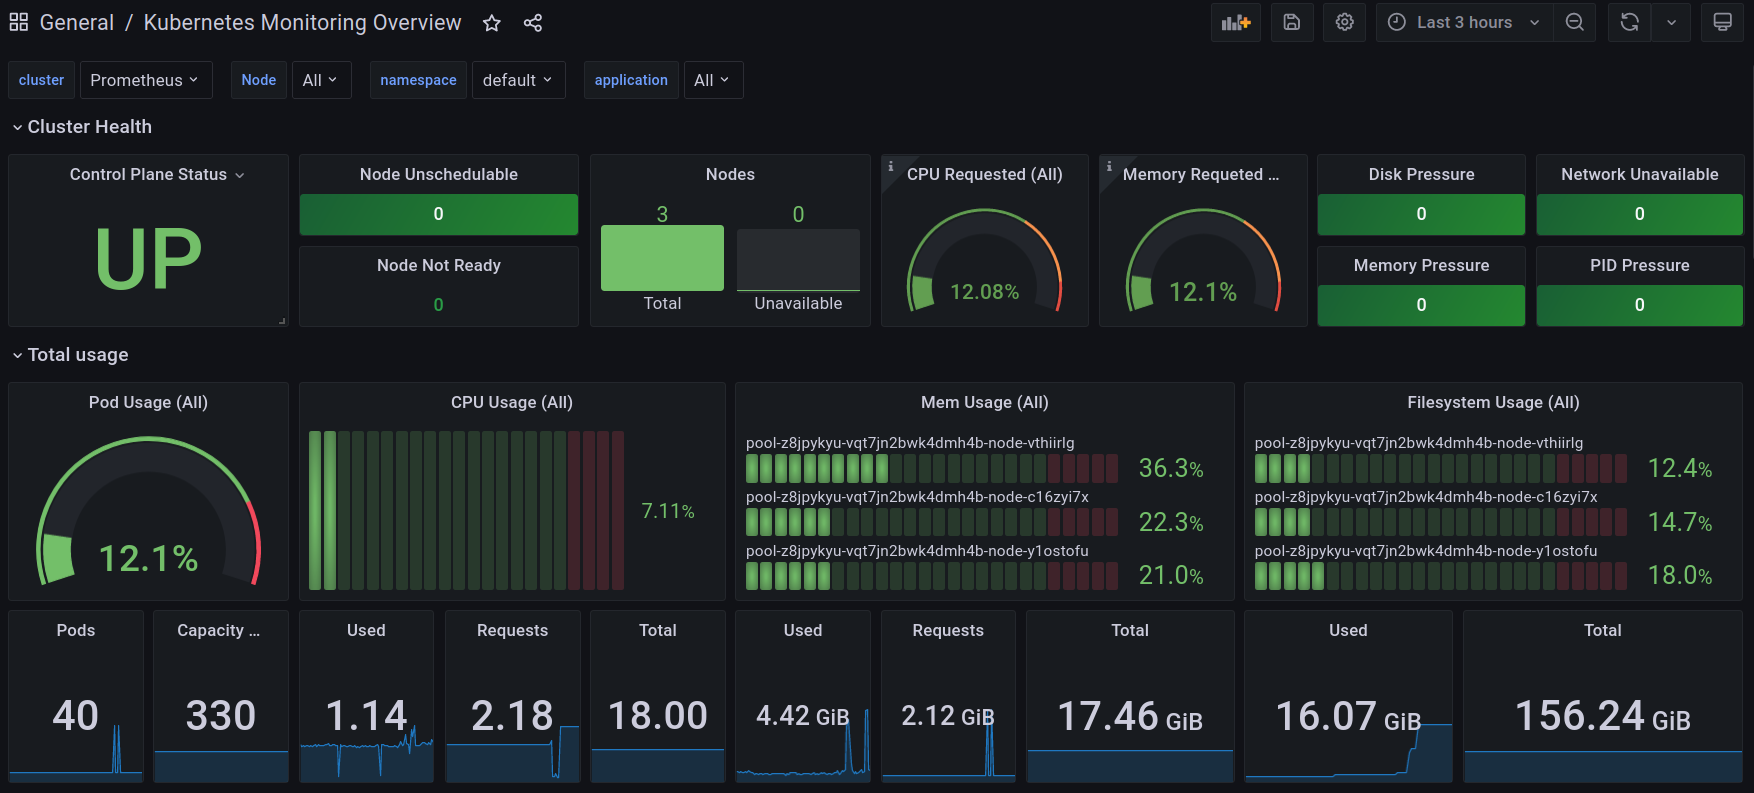
This dashboard provides a real-time health and resource overview of a Kubernetes cluster, aggregating control-plane health, node readiness, and per-node resource usage. It highlights key metrics such as up, kube_node_status_condition, and kube_pod_container_resource_requests to quickly identify unavailable components, unschedulable nodes, and per-node resource requests, with panels for CPU, memory, disk, and network pressure to gauge capacity and utilization across the cluster.
Screenshots
Used Metrics 2828
apiserver_request_duration_seconds_bucket
apiserver_request_total
-
container_cpu_usage_seconds_total
-
container_fs_limit_bytes
-
container_fs_usage_bytes
-
container_memory_working_set_bytes
-
container_network_receive_bytes_total
-
container_network_transmit_bytes_total
etcd_request_duration_seconds_bucket
kube_node_info
kube_node_spec_unschedulable
kube_node_status_condition
kube_pod_container_resource_requests
kube_pod_container_status_restarts_total
kube_pod_info
-
machine_cpu_cores
-
machine_memory_bytes
-
node_cpu_seconds_total
-
node_filesystem_avail_bytes
-
node_filesystem_size_bytes
-
node_memory_Buffers_bytes
-
node_memory_Cached_bytes
-
node_memory_MemFree_bytes
-
node_memory_MemTotal_bytes
topk
-
up
workqueue_queue_duration_seconds_bucket
workqueue_work_duration_seconds_bucket