Kubernetes Node Resource Consumption 63,39763,397 5.0 (1 reviews)
11/1/2018
11/2/2018
3
>=5.3.2
Prometheus
Description
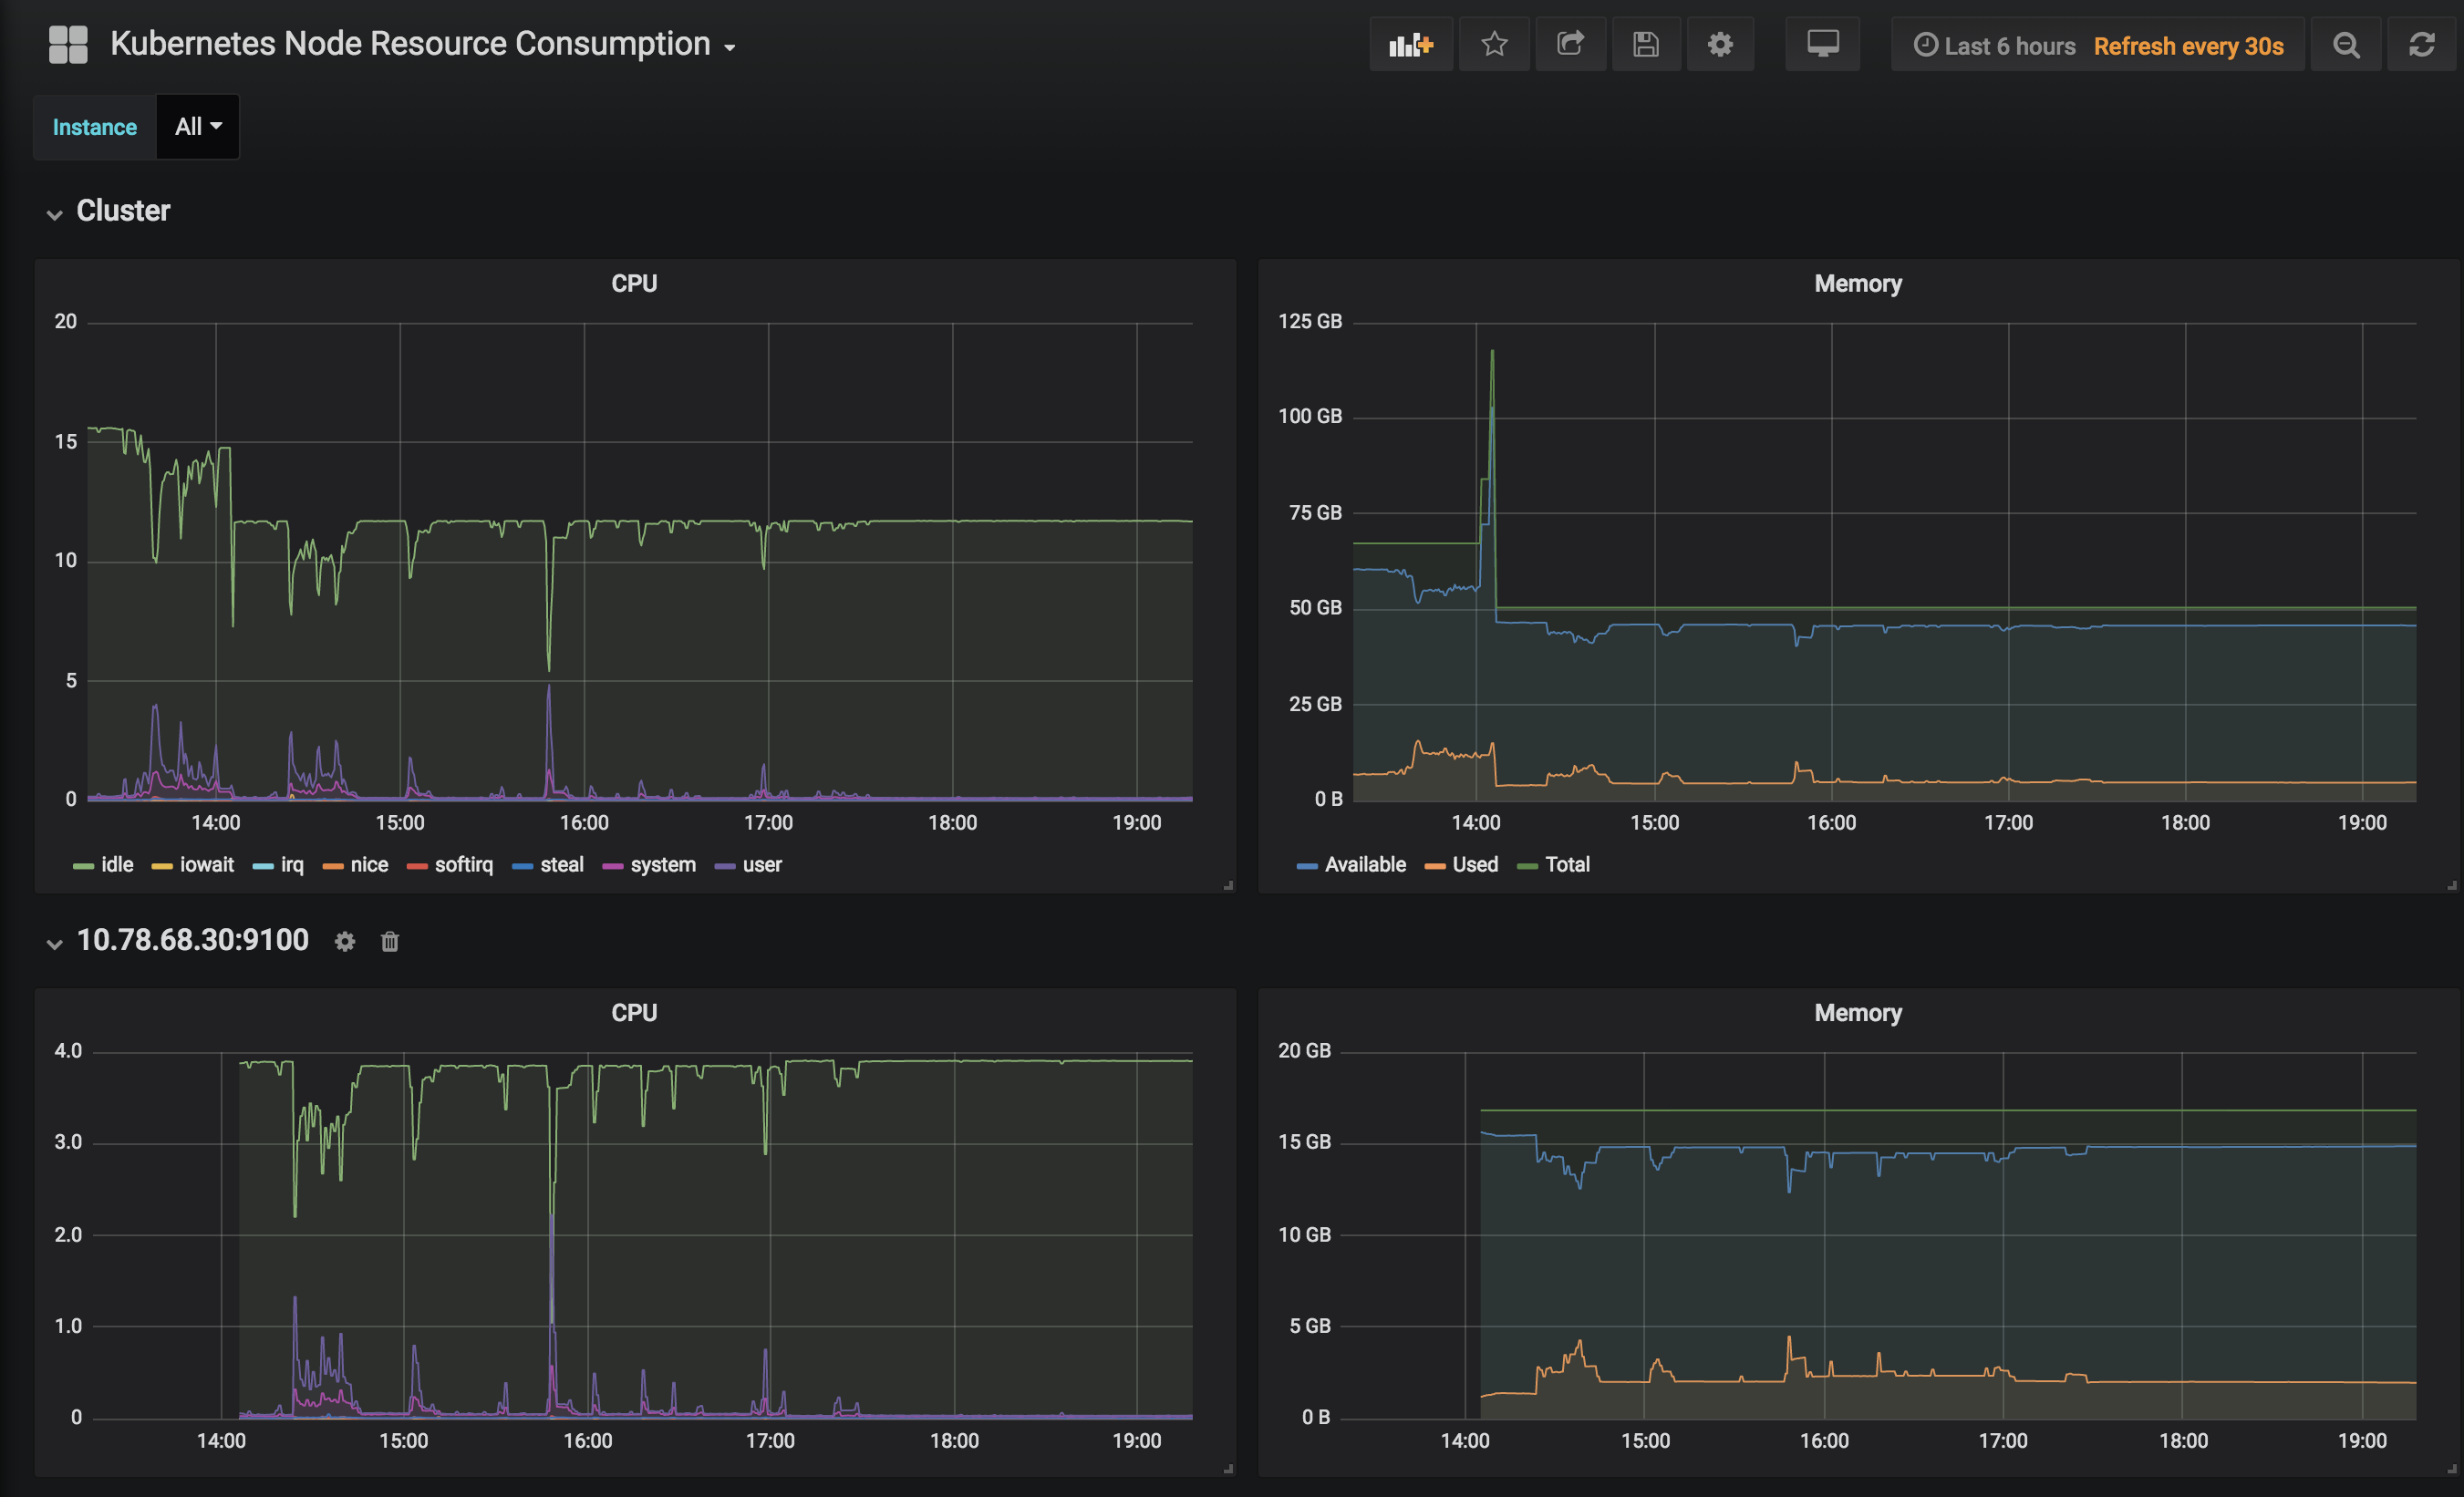
This dashboard monitors node resource consumption in Kubernetes by visualizing core metrics such as CPU usage, memory availability, and total memory. It includes panels for node_cpu_seconds_total and node_memory_MemAvailable_bytes alongside node_memory_MemTotal_bytes to show utilization, free headroom, and capacity trends over time, enabling quick detection of bottlenecks and resource pressure. Key features include time-series graphs with per-node breakdowns and comparative views to assess how CPU and memory contention evolves across the cluster.
Screenshots
Get Dashboard✕
Download
Copy to Clipboard