Kubernetes Status 69,88469,884 5.0 (1 reviews)
3/23/2018
3/23/2018
2
Host Metrics
>=5.0.1
Prometheus
Description
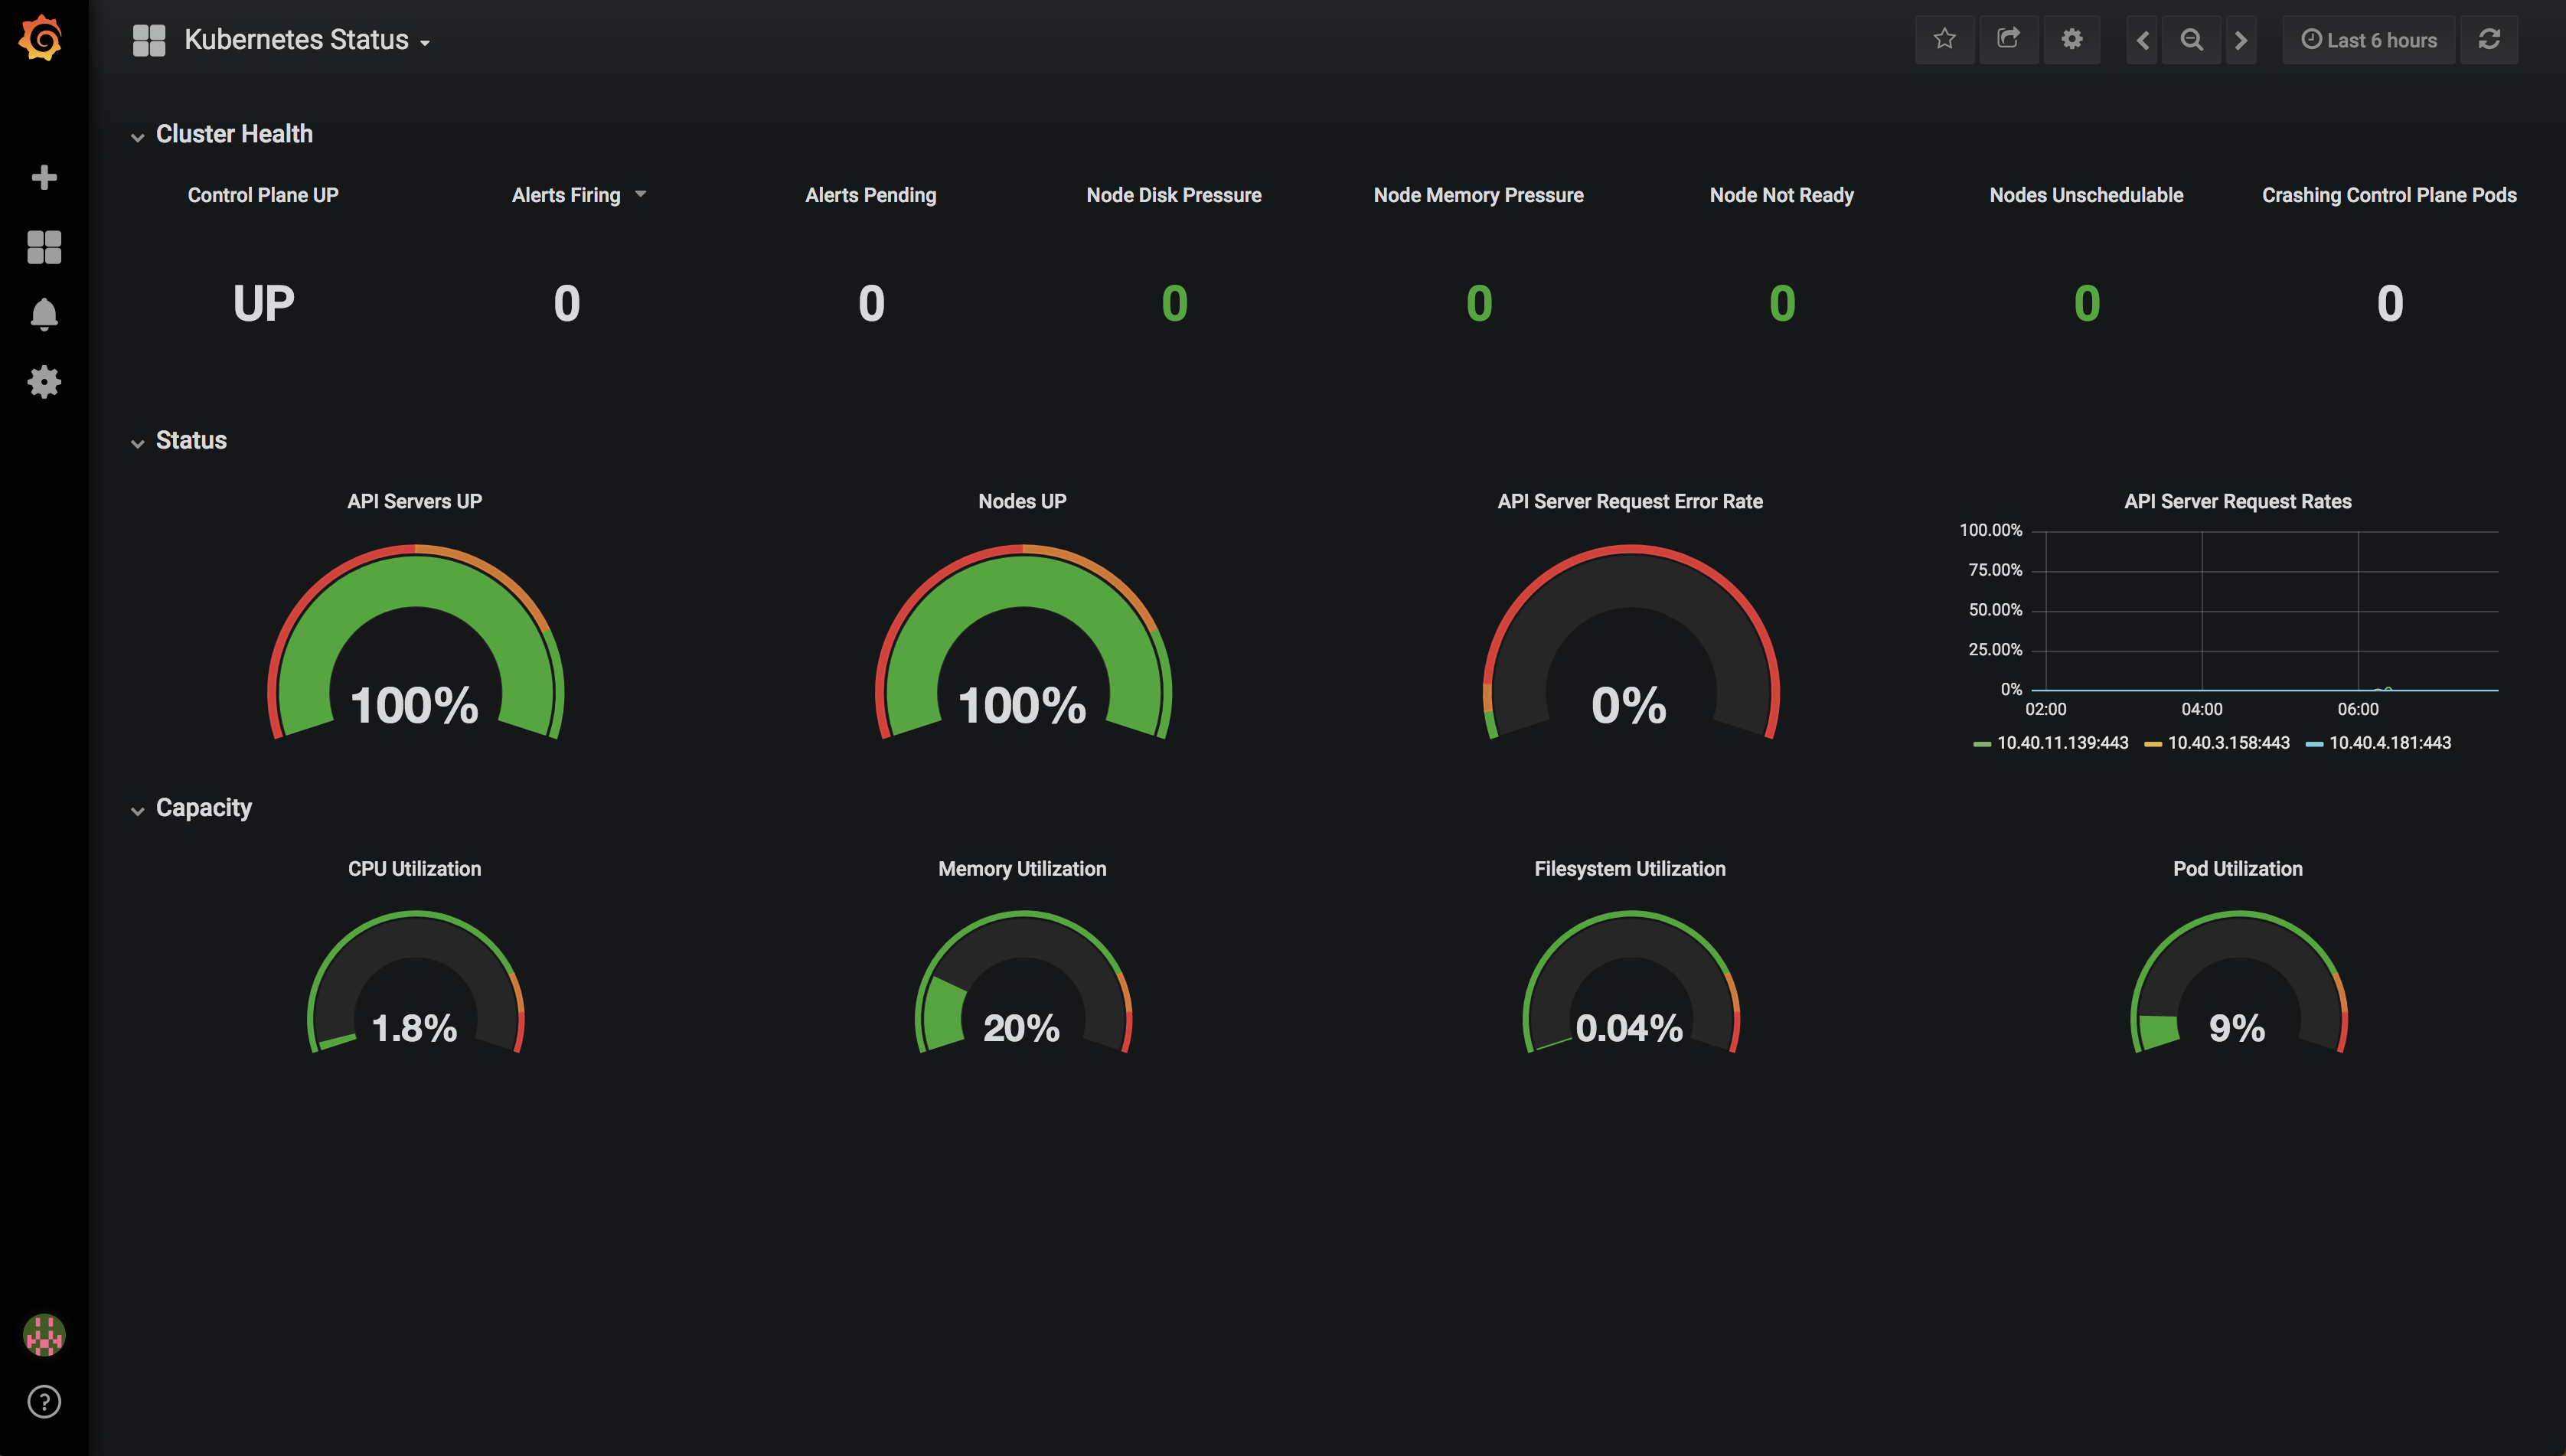
This dashboard monitors the health and performance of a Kubernetes cluster, combining control plane status, node readiness, and API server metrics to highlight operational issues. It aggregates up signals, alert states, and resource utilization to surface problems such as pod failures and node pressure, with key indicators like APIServer Request Rates, CPU Utilization, and Memory Utilization to gauge capacity and reliability.
Screenshots
Used Metrics 1515
ALERTS
apiserver_request_count
kube_node_spec_unschedulable
kube_node_status_capacity_pods
kube_node_status_condition
kube_pod_container_status_restarts
kube_pod_info
node_cpu
node_filesystem_free
node_filesystem_size
node_memory_Buffers
node_memory_Cached
node_memory_MemFree
node_memory_MemTotal
-
up
Get Dashboard✕
Download
Copy to Clipboard