Kubernetes / System / CoreDNS 5,022,0935,022,093 5.0 (1 reviews)
Description
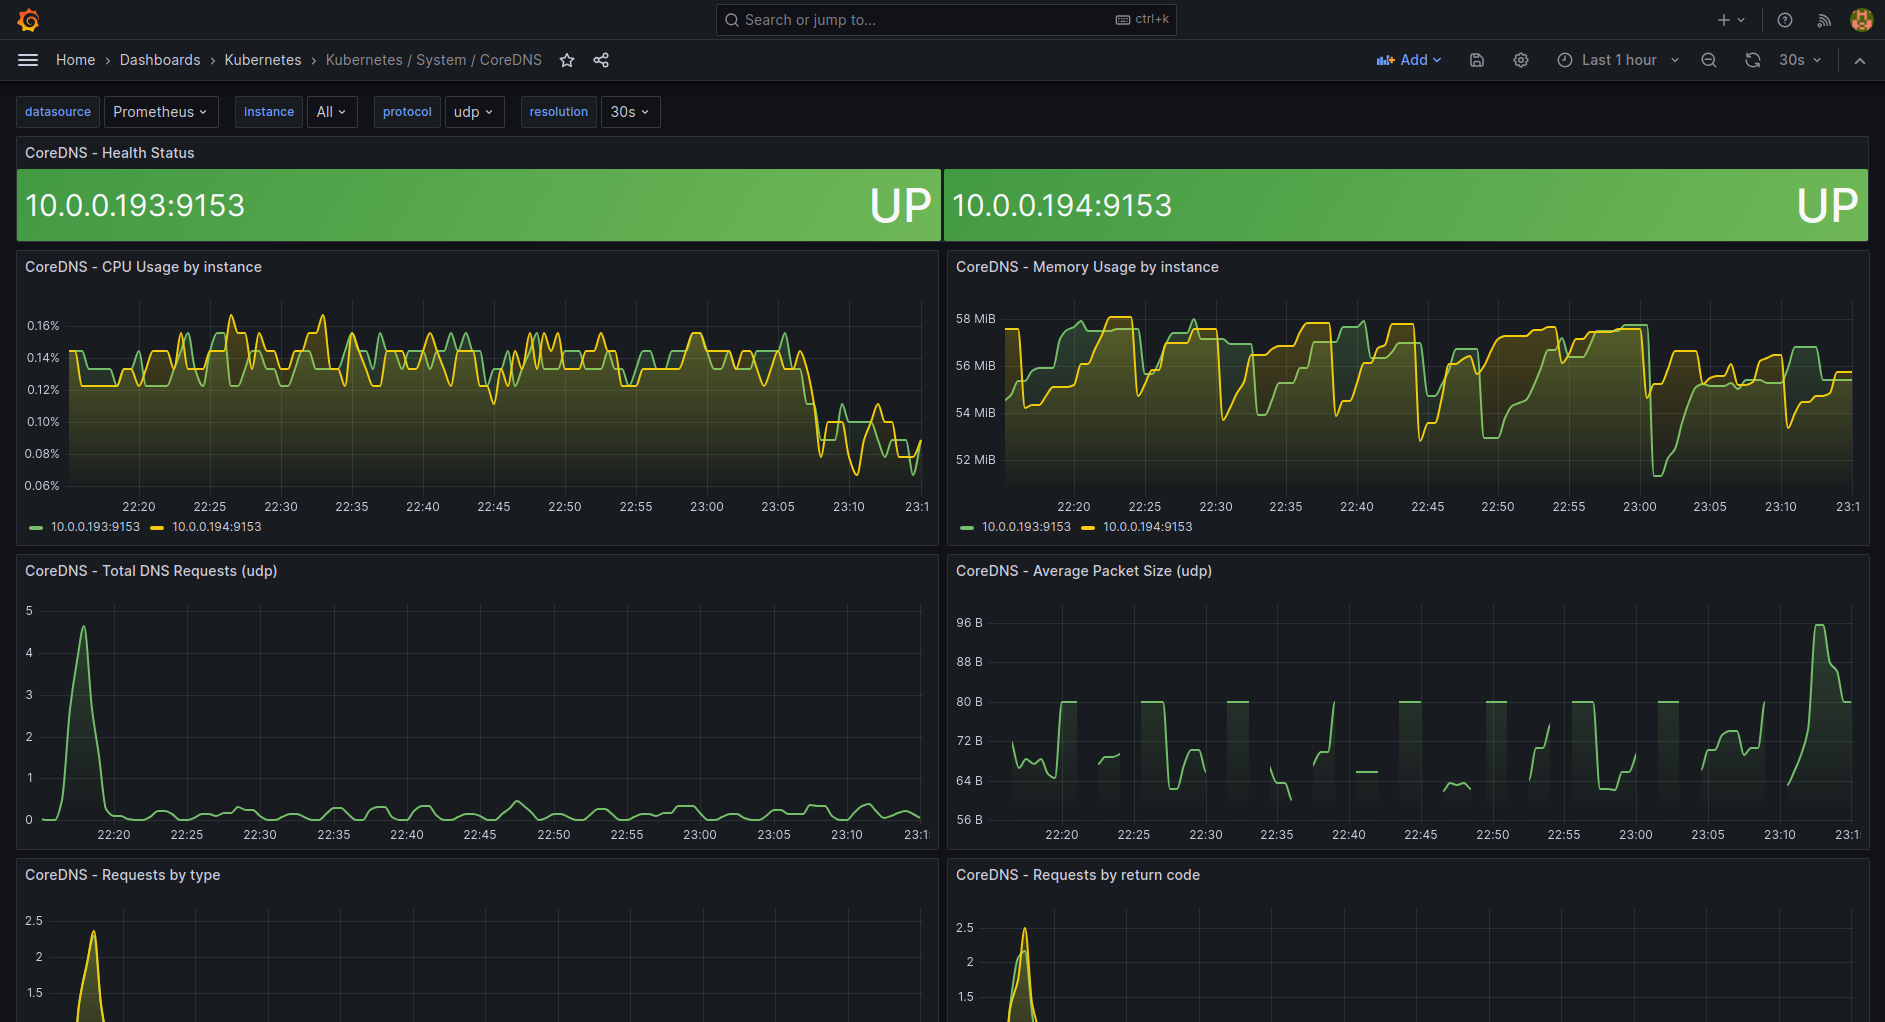
This dashboard monitors CoreDNS health and performance within a Kubernetes cluster, aggregating both node-level stability and per-instance resource usage. It emphasizes live request metrics such as coredns_dns_requests_total and response duration through coredns_proxy_request_duration_seconds_count, while also providing resource utilization insights via process_cpu_seconds_total and process_resident_memory_bytes for CPU and memory, respectively, and cache efficiency through coredns_cache_hits_total and coredns_cache_misses_total.
Screenshots
Used Metrics 1414
coredns_cache_entries
coredns_cache_hits_total
coredns_cache_misses_total
coredns_dns_request_duration_seconds_bucket
coredns_dns_request_size_bytes_bucket
coredns_dns_request_size_bytes_count
coredns_dns_request_size_bytes_sum
coredns_dns_requests_total
coredns_dns_response_size_bytes_bucket
coredns_dns_responses_total
coredns_proxy_request_duration_seconds_count
-
process_cpu_seconds_total
-
process_resident_memory_bytes
-
up