Loki stack monitoring (Promtail, Loki) 41,977,32441,977,324 4.3 (4 reviews)
Description
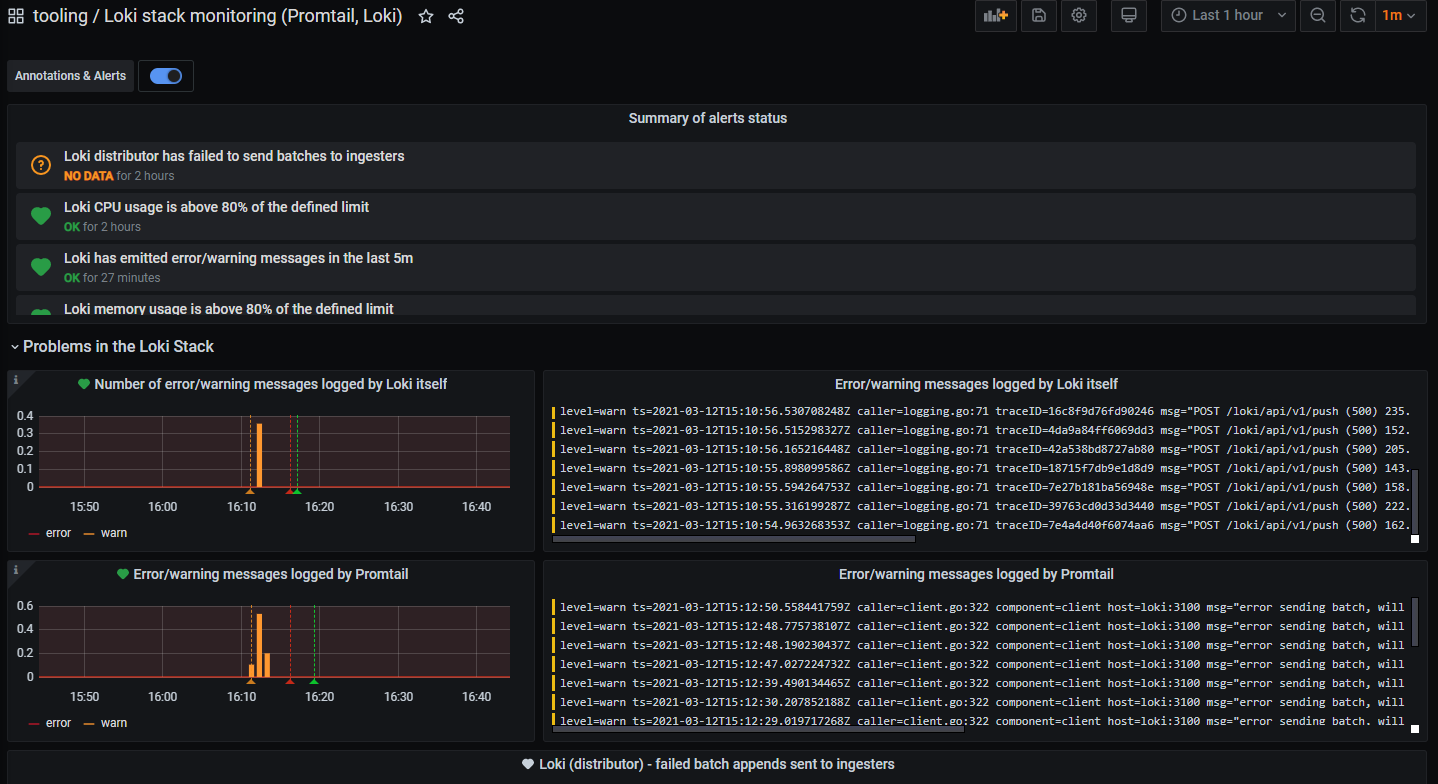
This Grafana dashboard provides end-to-end visibility into the Loki stack (Promtail, Loki) by correlating alert status, ingestion reliability, and component health across the distributor, ingester, and Promtail. It surfaces throughput and error signals, dropped entries, and health indicators, along with resource usage and capacity checks against Kubernetes limits and requests to support quick triage and planning. With focused panels on per-component health and pipeline metrics, it enables rapid troubleshooting and capacity forecasting for Loki deployments.
Screenshots
Used Metrics 1515
-
container_cpu_usage_seconds_total
-
container_memory_working_set_bytes
error
kube_pod_container_resource_limits_cpu_cores
kube_pod_container_resource_limits_memory_bytes
kube_pod_container_resource_requests_cpu_cores
kube_pod_container_resource_requests_memory_bytes
level
log_messages_total
loki_distributor_bytes_received_total
loki_distributor_ingester_append_failures_total
loki_distributor_lines_received_total
loki_ingester_memory_streams
promtail_dropped_entries_total
warn