Managed Kubernetes Overview 995995
9/24/2025
9/25/2025
6
Host Metrics
>=11.3.4
Description
This is a modern 'Global View' dashboard for your Kubernetes cluster(s). Made for kube-prometheus-stack and take advantage of the latest Grafana features. Forked and modified version of: https://github.com/dotdc/grafana-dashboards-kubernetes
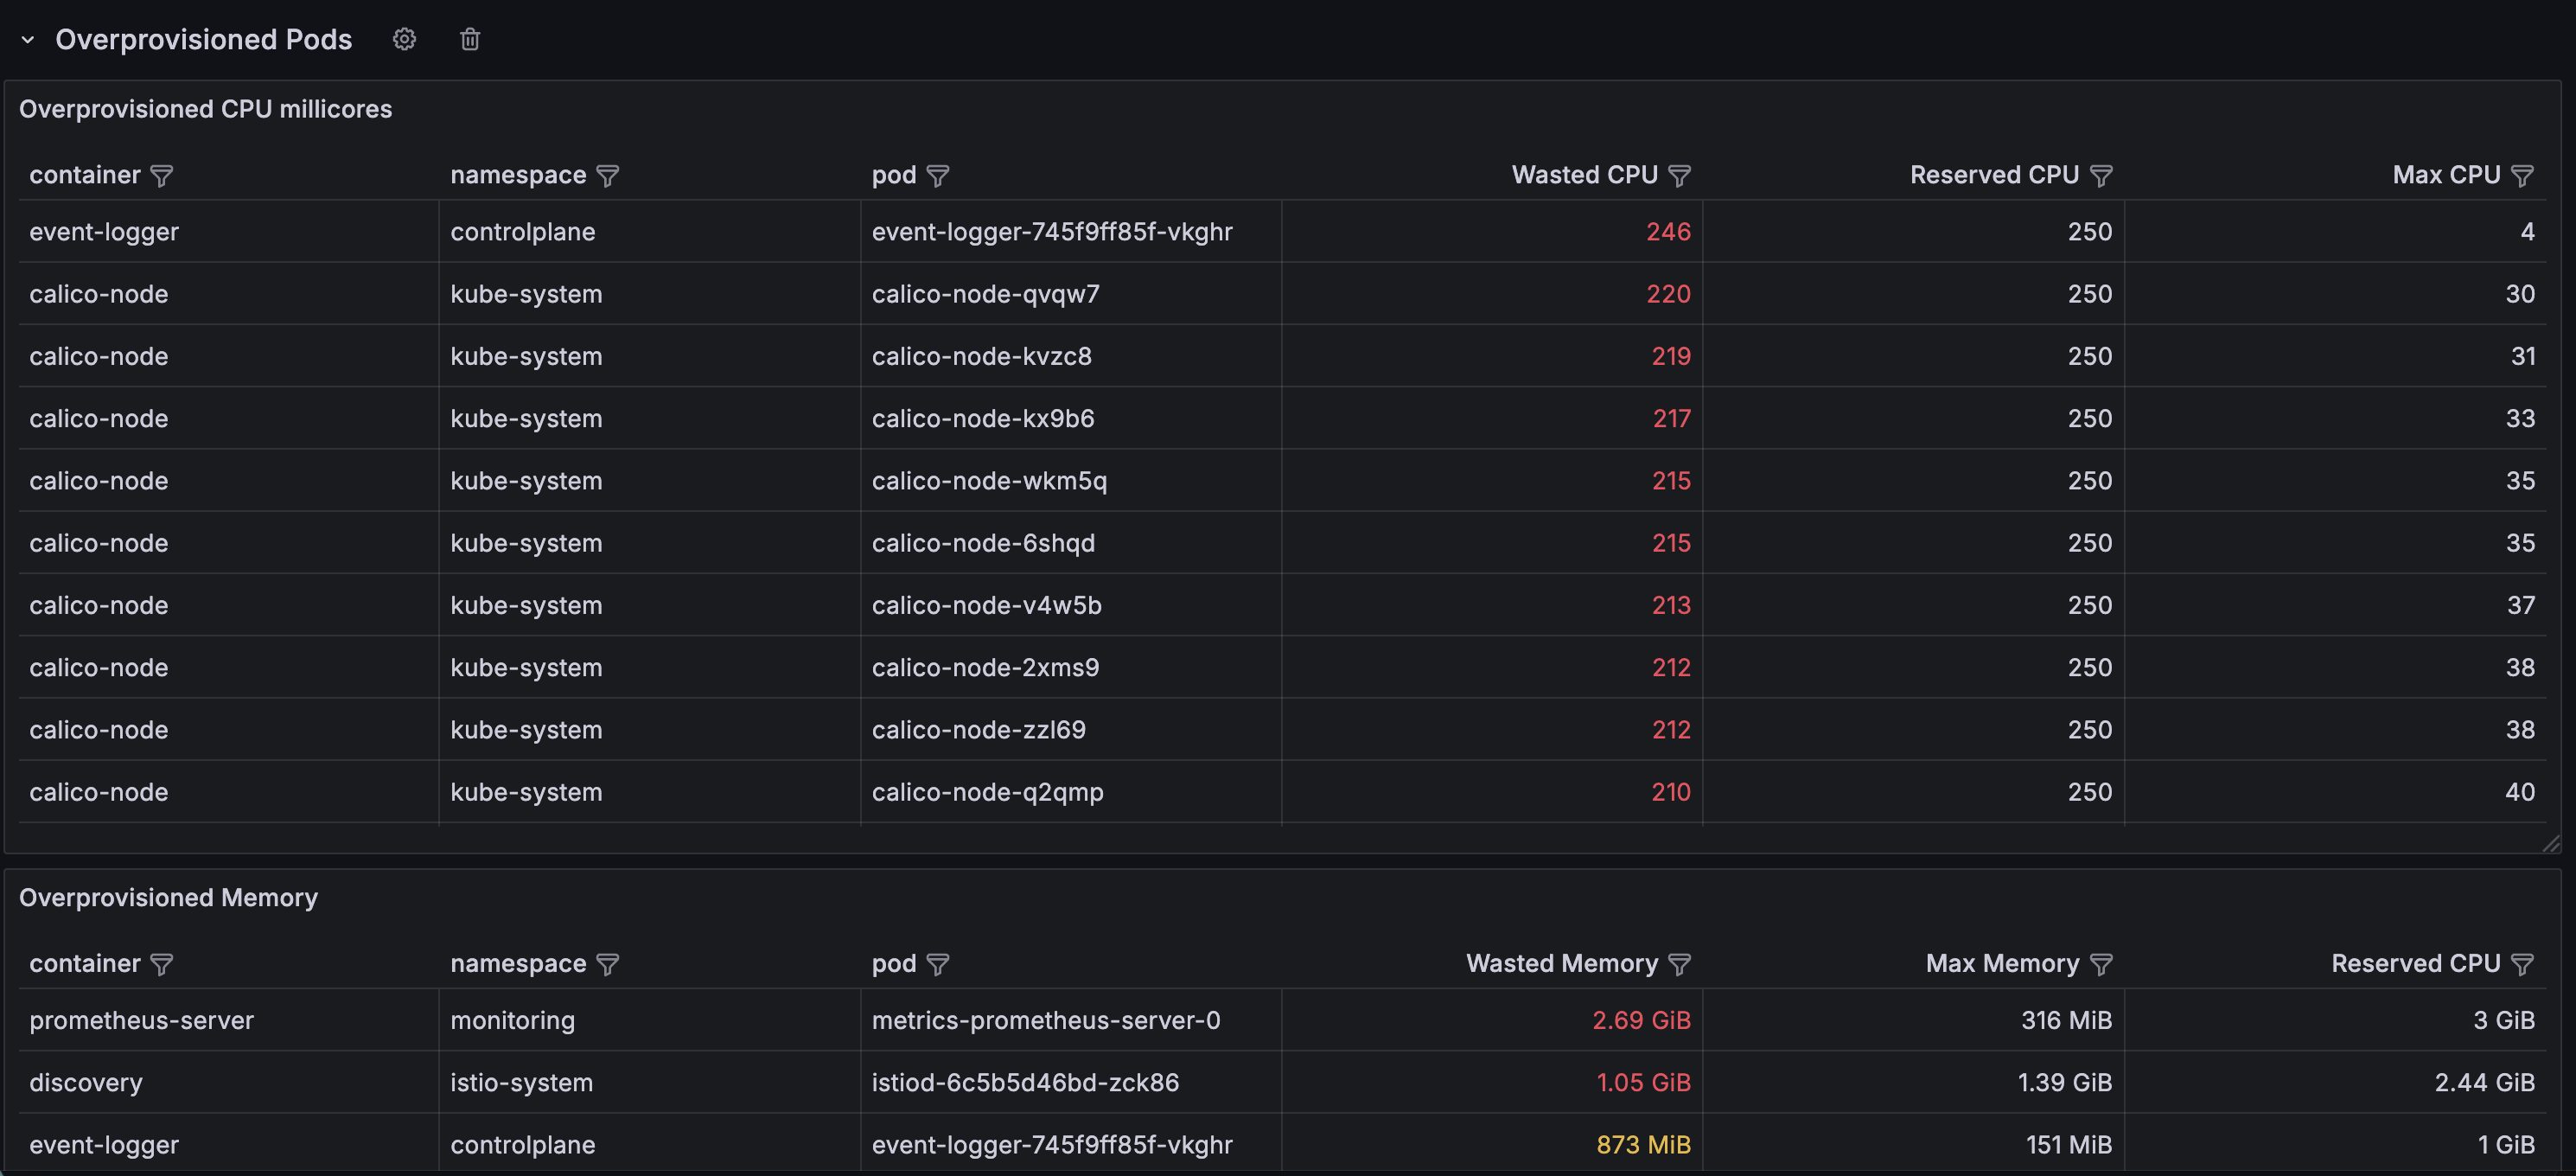
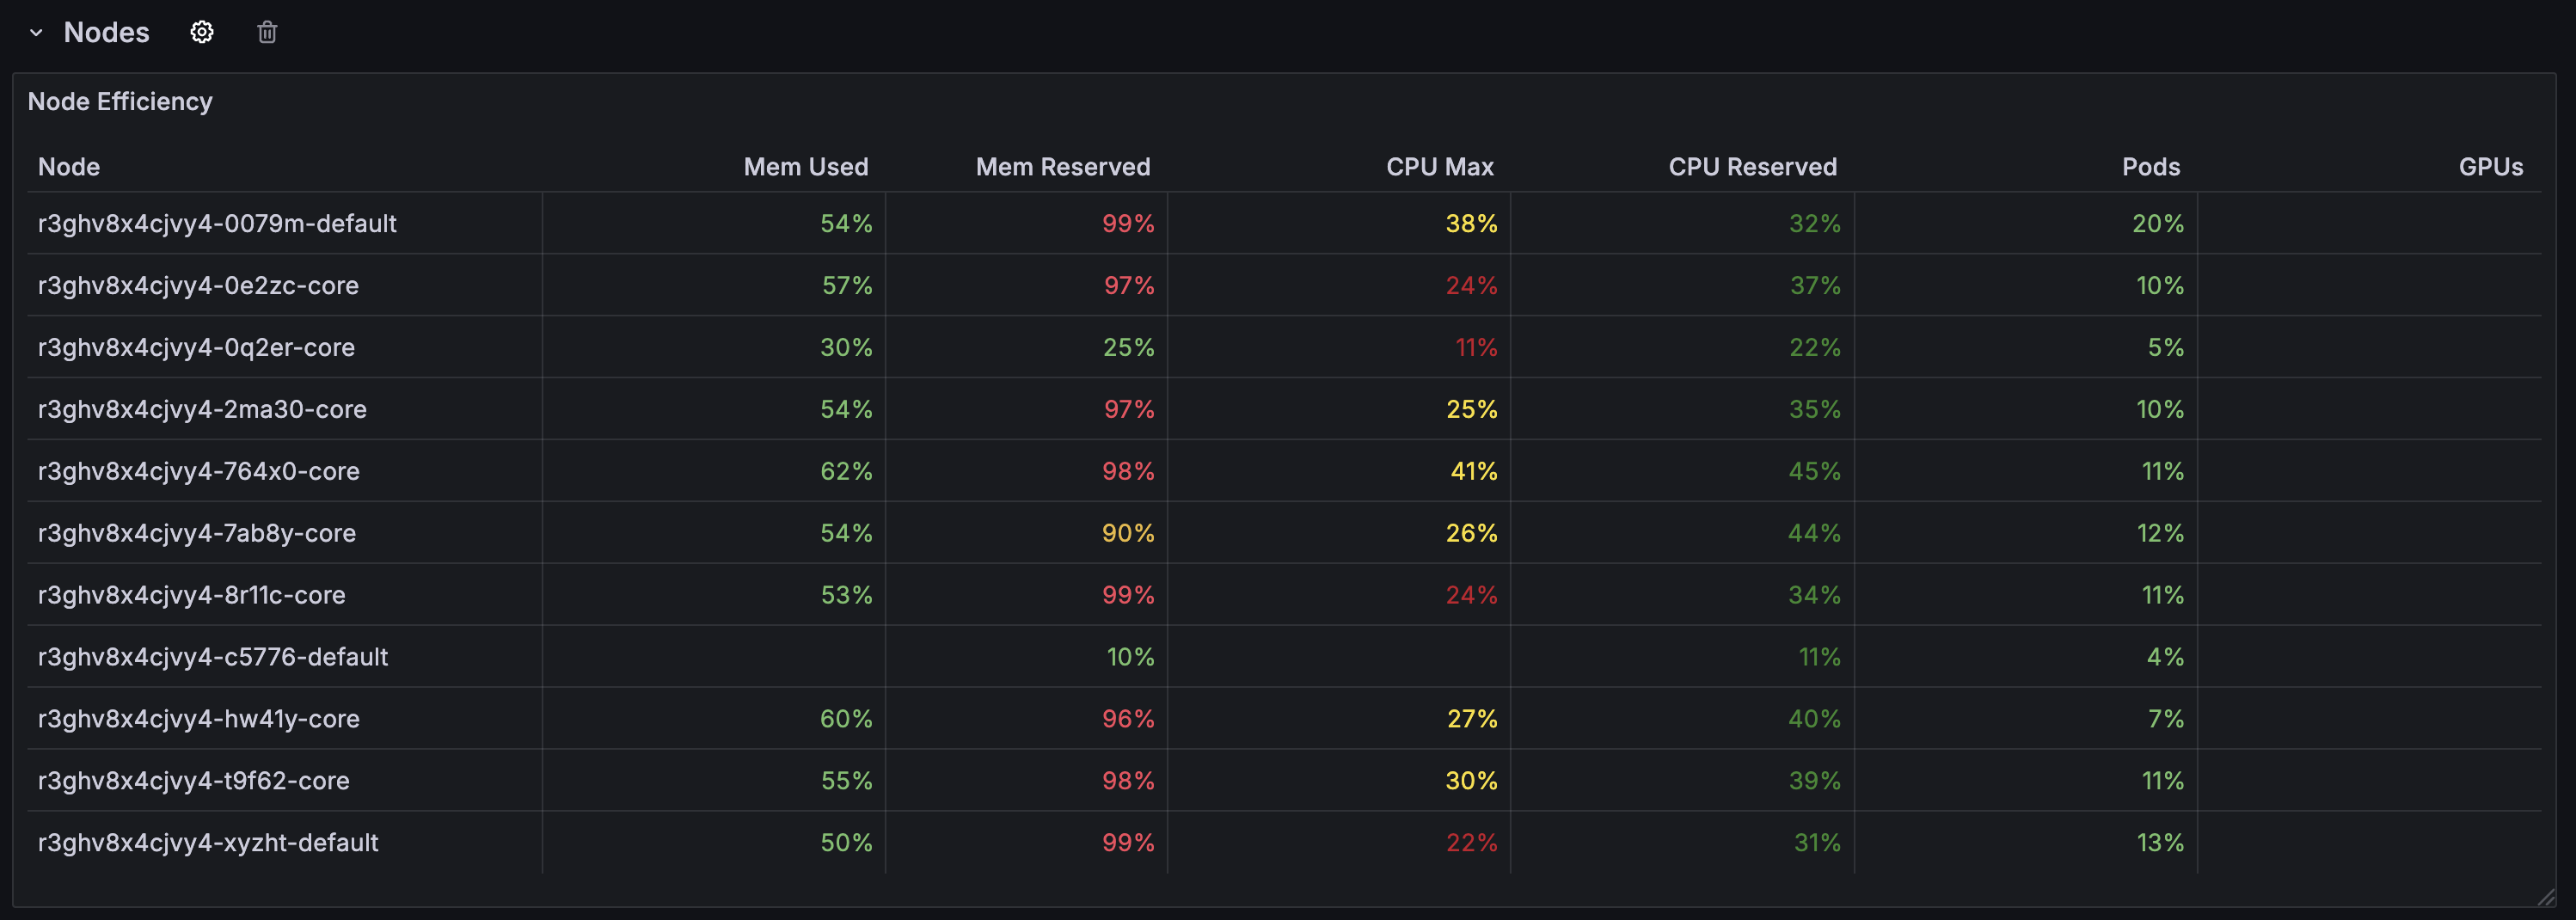
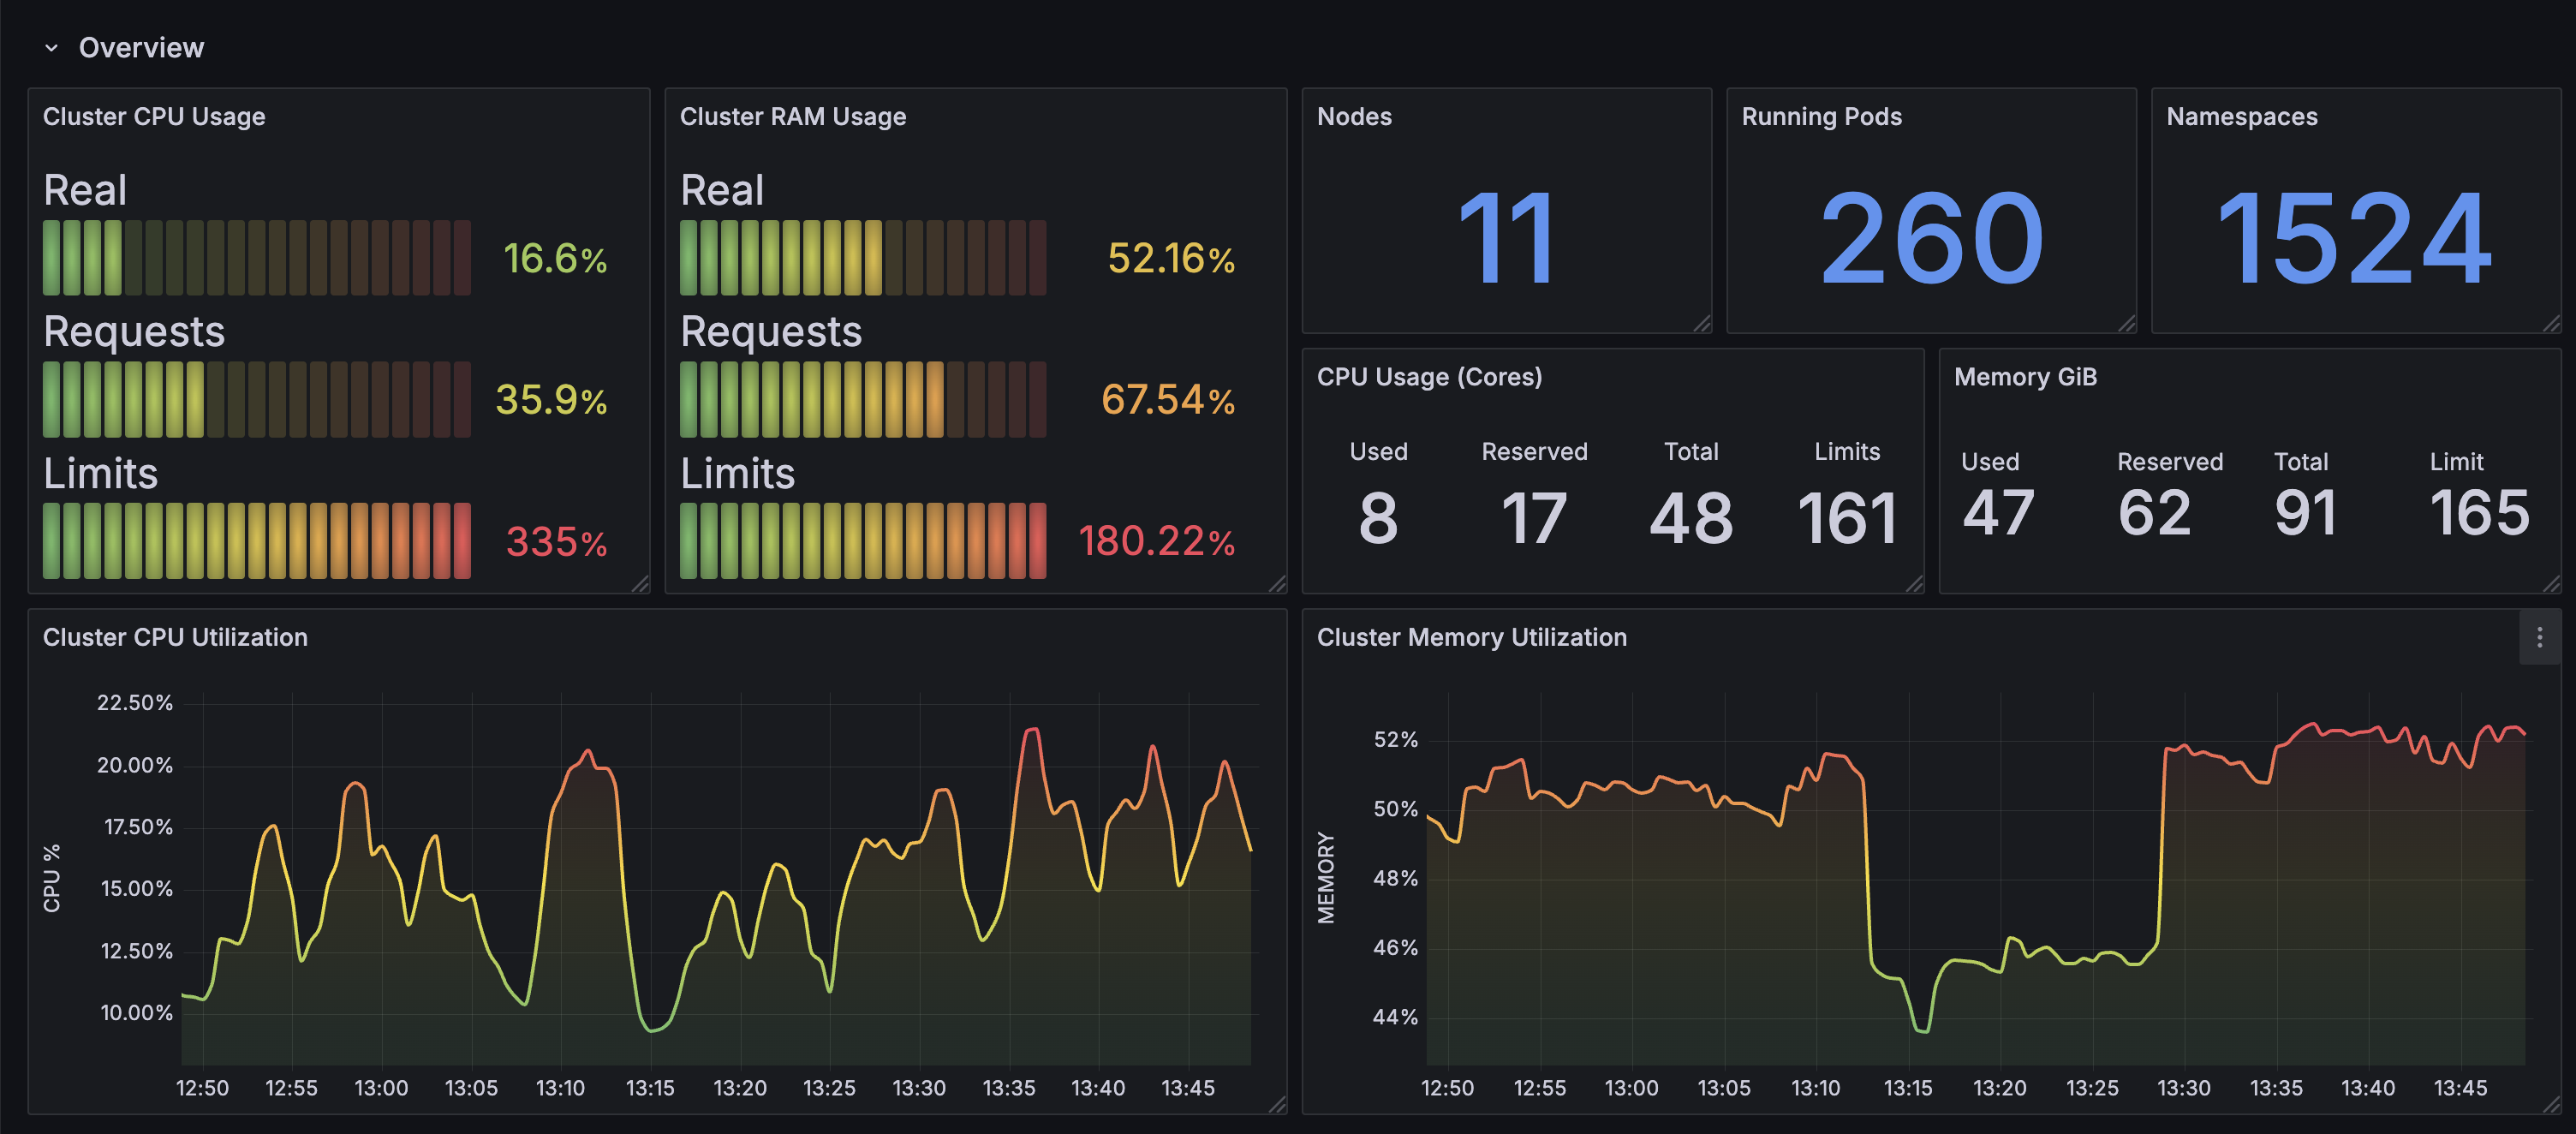
Screenshots
Used Metrics 2121
:
d
instance
kube_namespace_created
kube_node_info
kube_node_status_allocatable
kube_pod_container_resource_limits
kube_pod_container_resource_requests
kube_pod_info
kube_pod_status_phase
lookbackPeriod:
-
machine_cpu_cores
-
machine_memory_bytes
node
-
node_cpu_seconds_total
-
node_memory_MemAvailable_bytes
-
node_memory_MemTotal_bytes
windows_cpu_time_total
windows_memory_available_bytes
windows_memory_cache_bytes
windows_os_visible_memory_bytes
Get Dashboard✕
Download
Copy to Clipboard