Mattermost Performance Monitoring (Bonus Metrics) 4,5294,529
Description
Screenshots
Used Metrics 2222
-
go_gc_duration_seconds
-
go_memstats_heap_objects
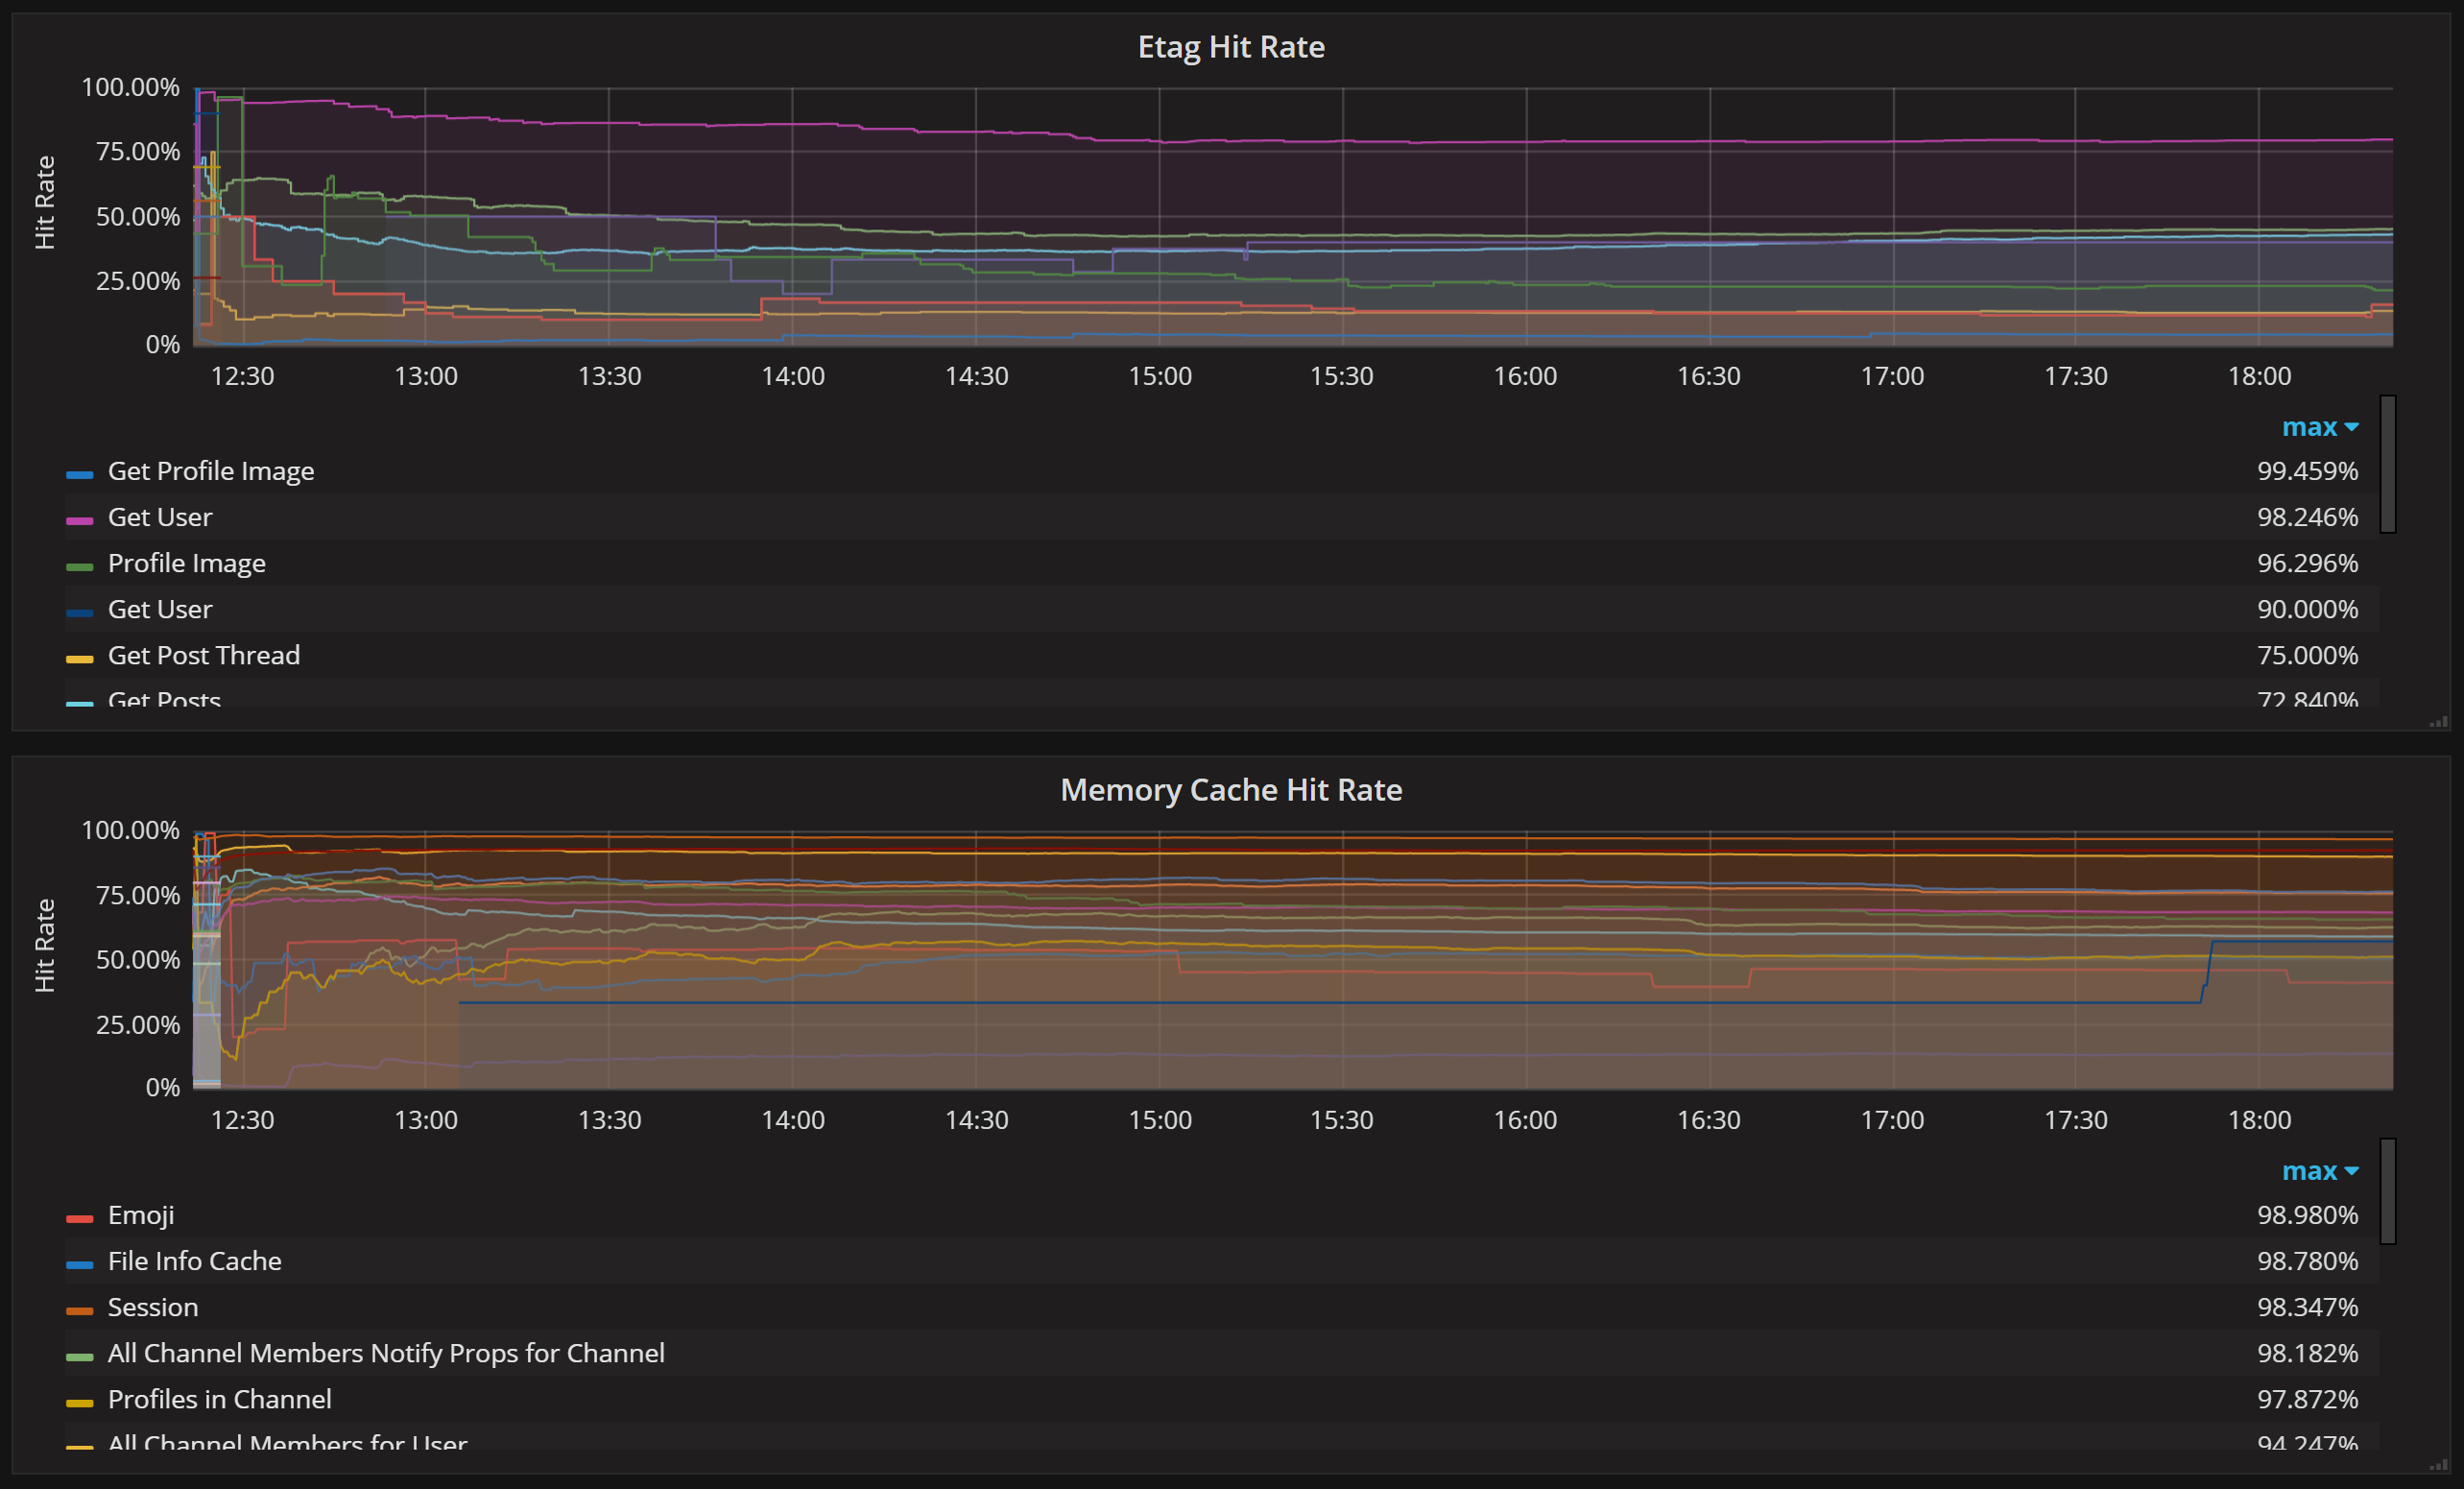
mattermost_cache_etag_hit_total
mattermost_cache_etag_miss_total
mattermost_cache_mem_hit_total
mattermost_cache_mem_miss_total
mattermost_cluster_cluster_event_type_totals
mattermost_cluster_cluster_requests_total
mattermost_http_requests_total
mattermost_login_logins_fail_total
mattermost_login_logins_total
mattermost_post_emails_sent_total
mattermost_post_file_attachments_total
mattermost_post_pushes_sent_total
mattermost_process_open_fds
mattermost_process_resident_memory_bytes
mattermost_process_virtual_memory_bytes
mattermost_search_posts_searches_duration_seconds_count
mattermost_search_posts_searches_duration_seconds_sum
mattermost_search_posts_searches_total
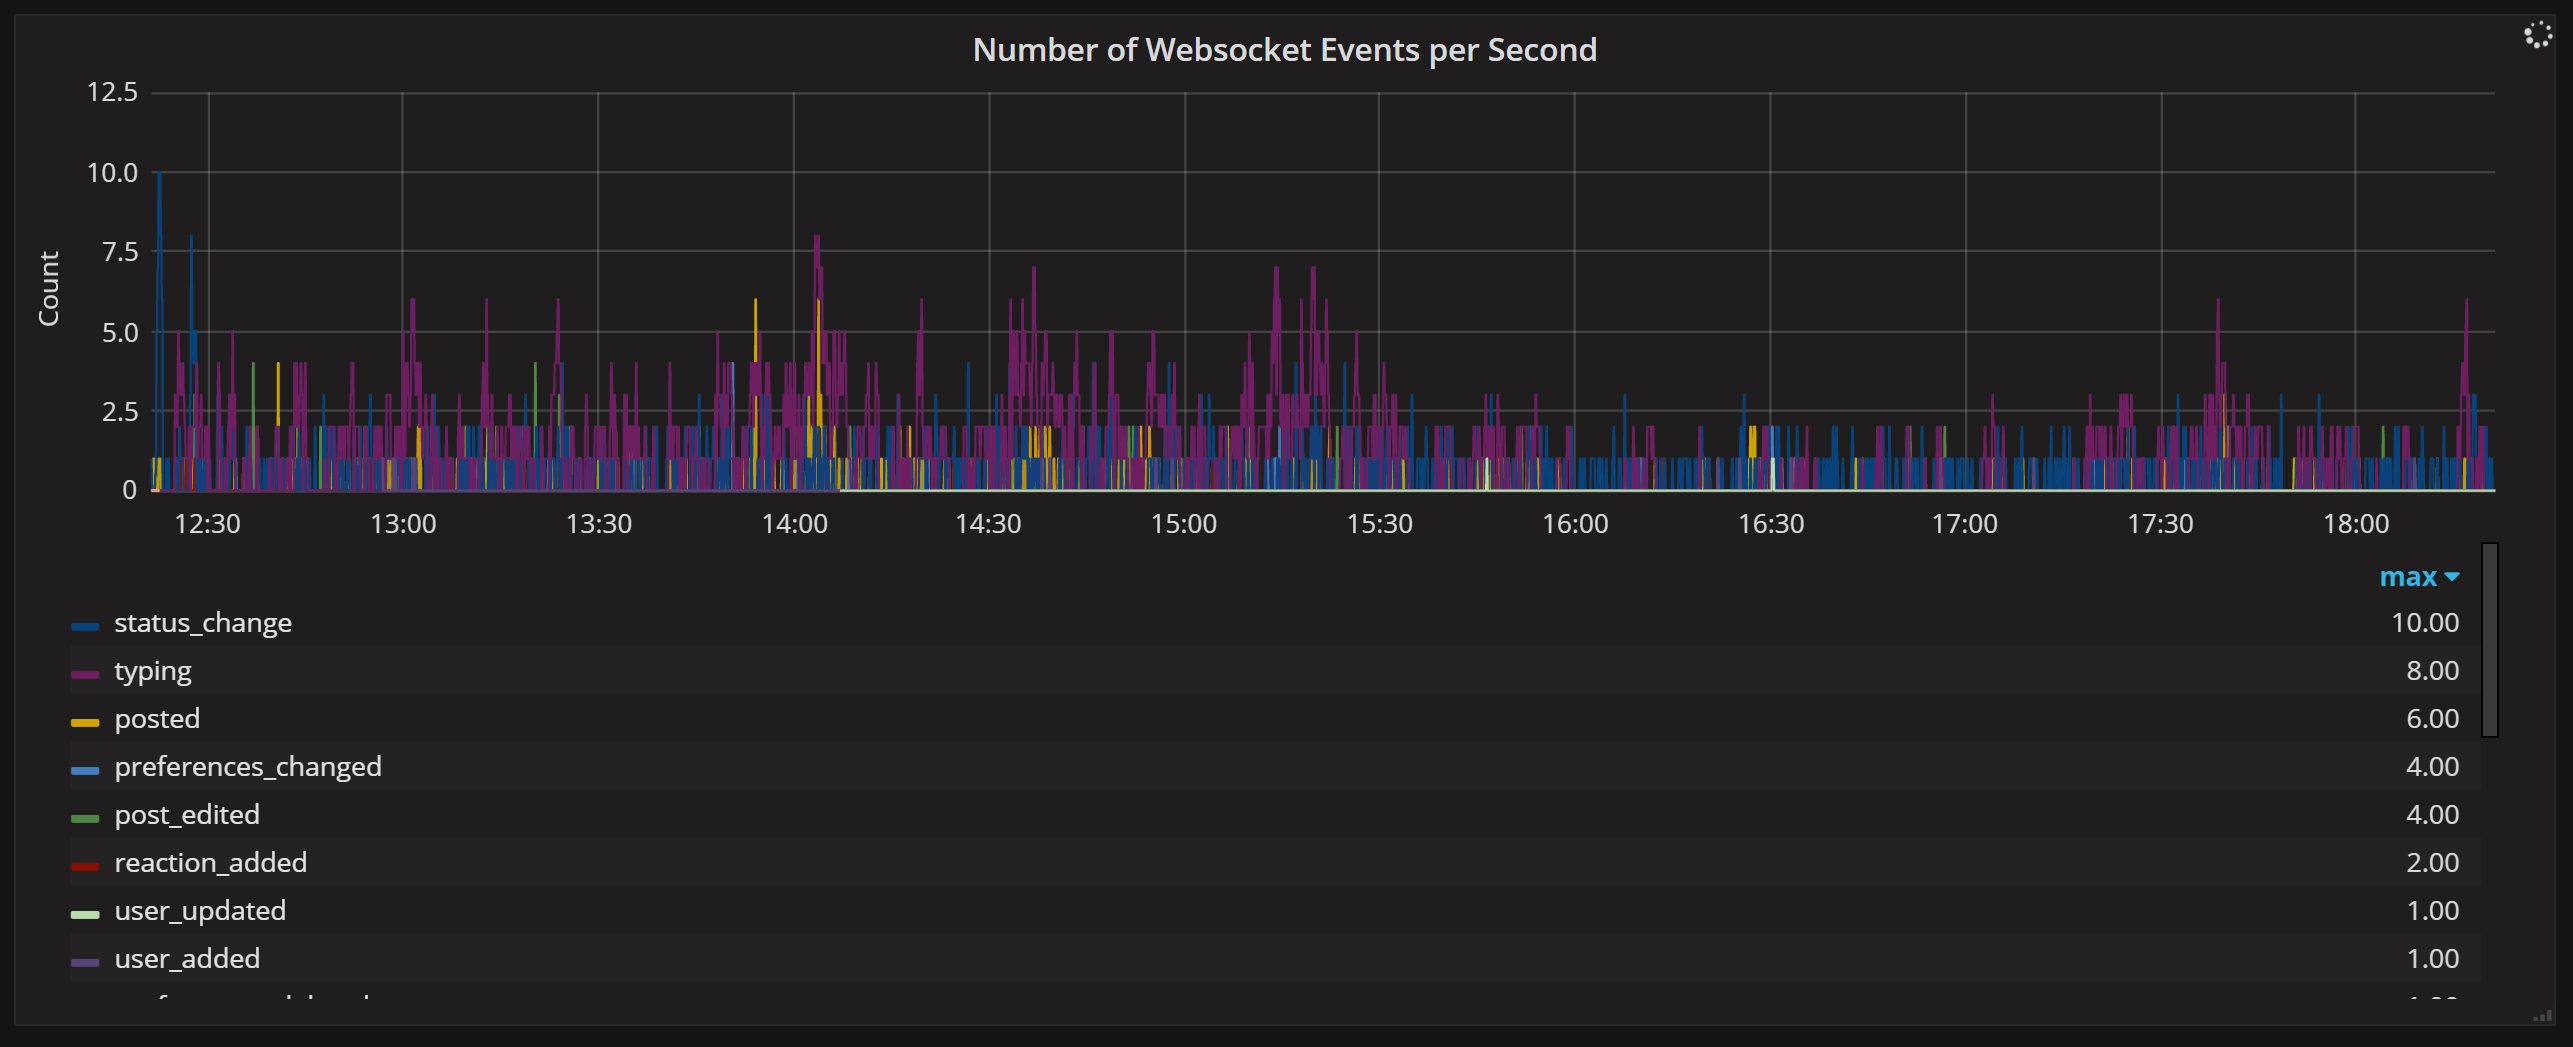
mattermost_websocket_broadcasts_total
mattermost_websocket_event_total