
memory 2,5342,534
Description
various memory metrics
Screenshots
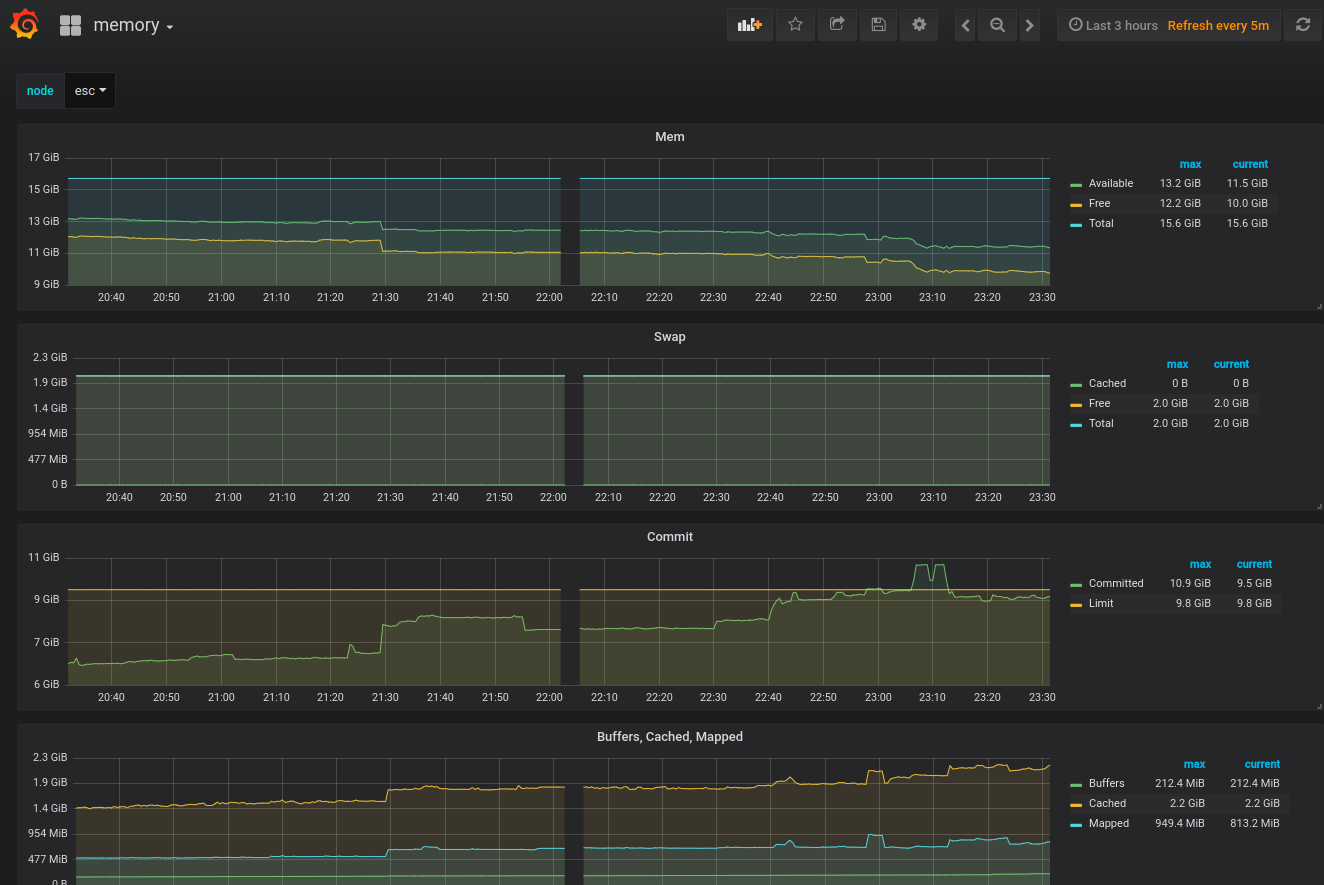
Used Metrics 3232
-
node_memory_Active_anon_bytes
-
node_memory_Active_bytes
-
node_memory_Active_file_bytes
node_memory_AnonHugePages_bytes
-
node_memory_AnonPages_bytes
-
node_memory_Bounce_bytes
-
node_memory_Buffers_bytes
-
node_memory_Cached_bytes
-
node_memory_CommitLimit_bytes
-
node_memory_Committed_AS_bytes
-
node_memory_Dirty_bytes
node_memory_HardwareCorrupted_bytes
-
node_memory_Inactive_anon_bytes
-
node_memory_Inactive_bytes
-
node_memory_Inactive_file_bytes
-
node_memory_KernelStack_bytes
-
node_memory_Mapped_bytes
-
node_memory_MemAvailable_bytes
-
node_memory_MemFree_bytes
-
node_memory_MemTotal_bytes
-
node_memory_Mlocked_bytes
-
node_memory_PageTables_bytes
-
node_memory_SReclaimable_bytes
-
node_memory_SUnreclaim_bytes
-
node_memory_Shmem_bytes
-
node_memory_Slab_bytes
-
node_memory_SwapCached_bytes
-
node_memory_SwapFree_bytes
-
node_memory_SwapTotal_bytes
-
node_memory_Unevictable_bytes
-
node_memory_WritebackTmp_bytes
-
node_memory_Writeback_bytes