Monitor Pod CPU and Memory usage 72,85872,858
Description
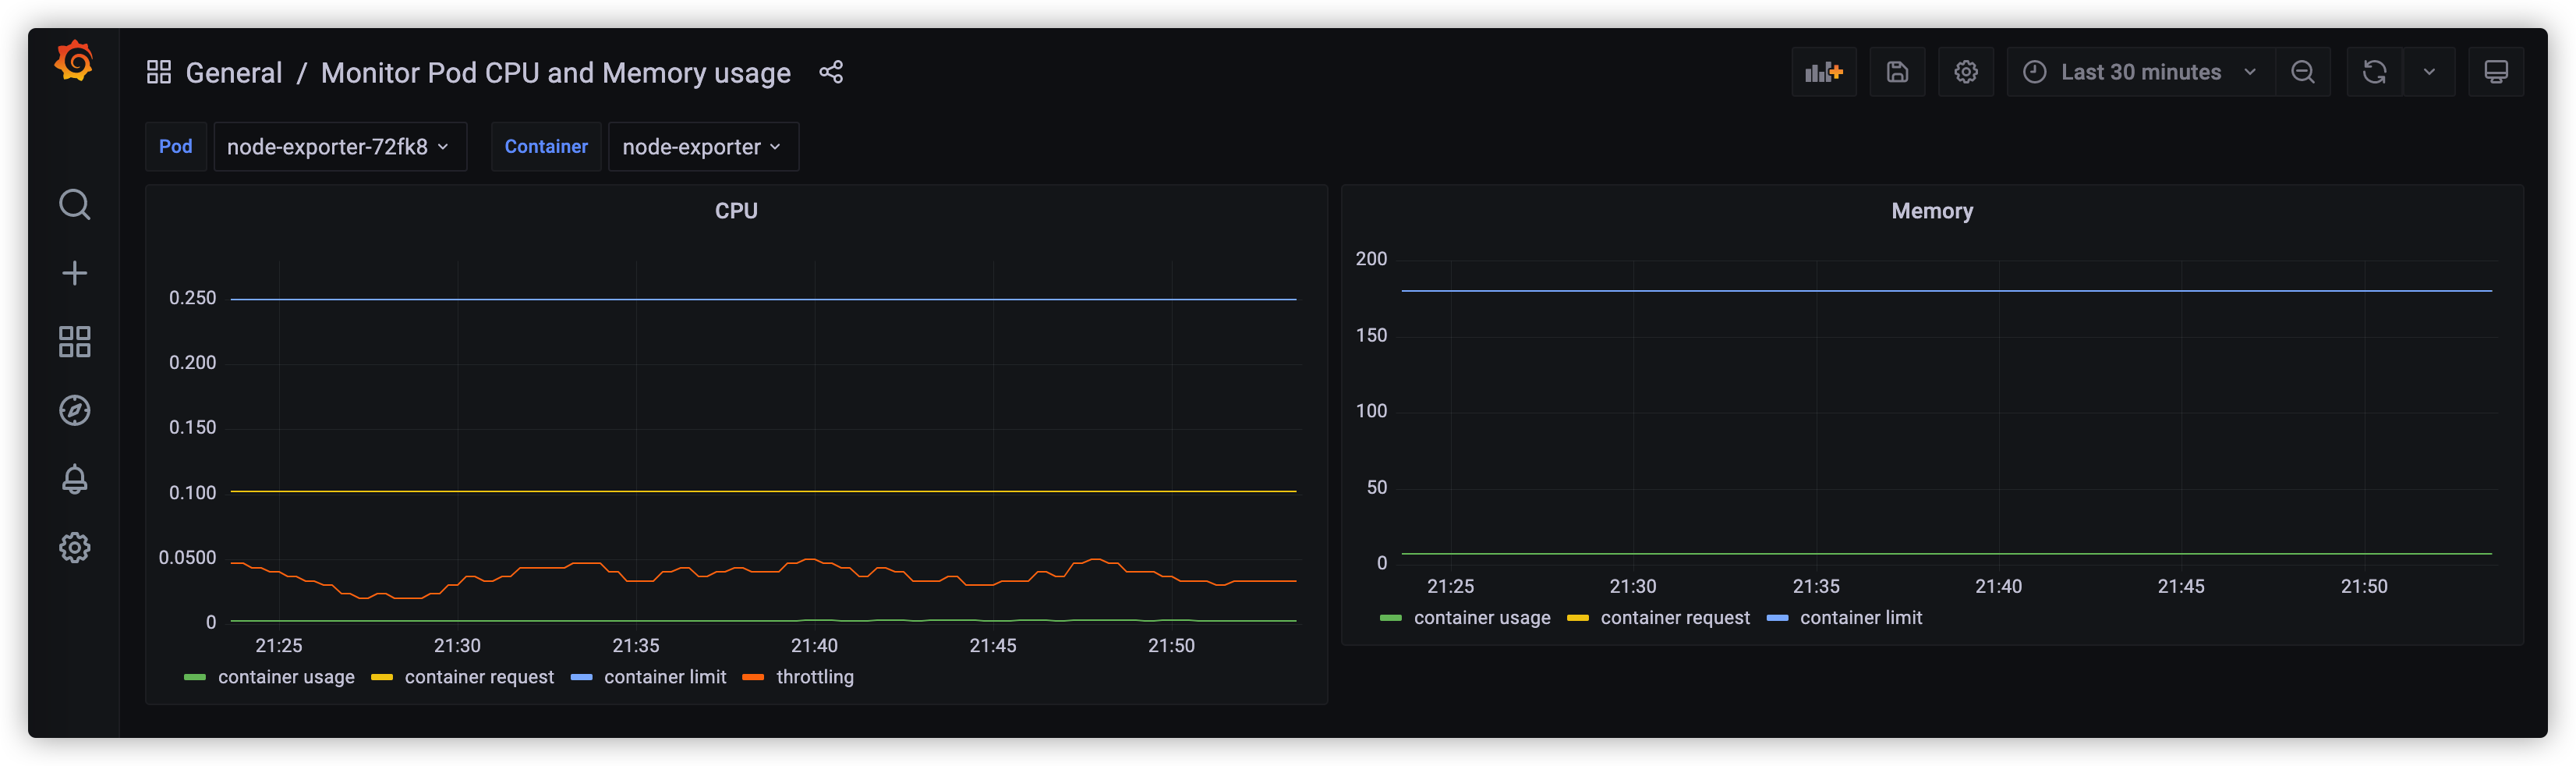
This dashboard monitors pod-level resource usage, focusing on CPU and memory, with panels for container_cpu_usage_seconds_total and container_memory_usage_bytes to track actual consumption. It also exposes expected resource settings via kube_pod_container_resource_requests and kube_pod_container_resource_limits to compare against observed usage, and surfaces CPU throttling and allocation efficiency through container_cpu_cfs_throttled_periods_total and container_cpu_cfs_periods_total. Aimed at understanding ownership and workload impact, it incorporates ownership metadata (e.g., owner_name, kube_pod_owner) and supports distribution views with quantile for latency-like metrics in CPU usage.
Screenshots
Used Metrics 1010
-
container_cpu_cfs_periods_total
-
container_cpu_cfs_throttled_periods_total
-
container_cpu_usage_seconds_total
-
container_memory_usage_bytes
-
container_memory_working_set_bytes
kube_pod_container_resource_limits
kube_pod_container_resource_requests
kube_pod_owner
owner_name
quantile