MySQL Exporter Quickstart and Dashboard 57,68557,685 5.0 (1 reviews)
Description
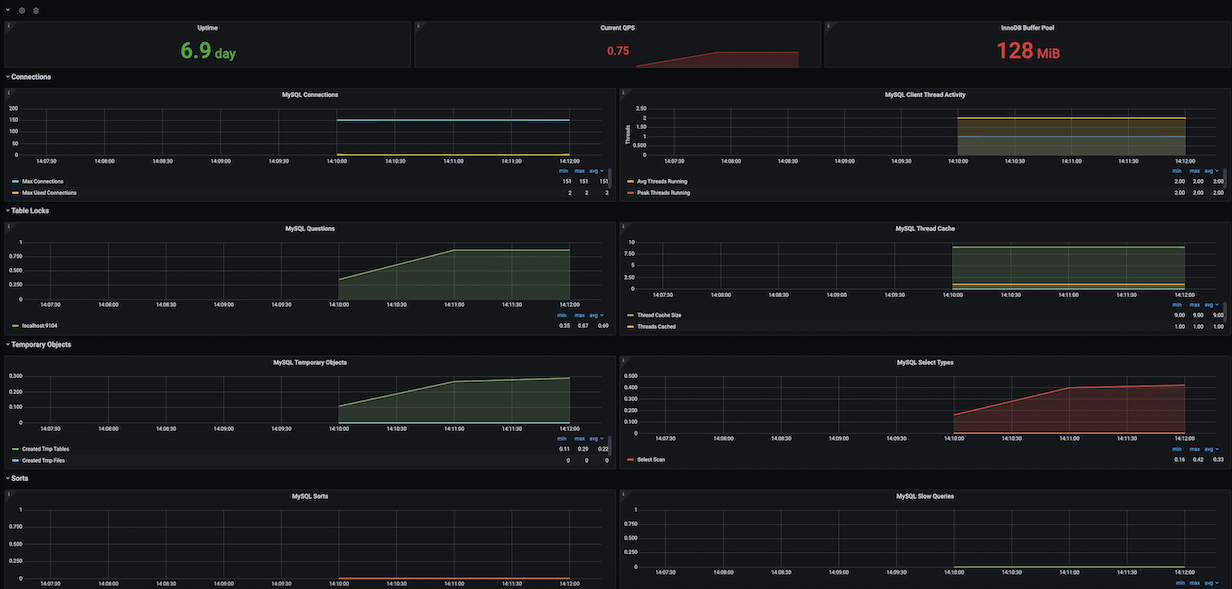
This dashboard provides a consolidated view of a MySQL server’s health and performance through key runtime and query metrics. It highlights uptime, QPS, and connection activity with panels like mysql_global_status_uptime, mysql_global_status_queries, and mysql_global_status_threads_connected to help identify stale performance, query load, and connection bottlenecks at a glance.
Screenshots
Used Metrics 6262
-
mysql_global_status_aborted_clients
-
mysql_global_status_aborted_connects
-
mysql_global_status_buffer_pool_pages
-
mysql_global_status_bytes_received
-
mysql_global_status_bytes_sent
-
mysql_global_status_commands_total
-
mysql_global_status_created_tmp_disk_tables
-
mysql_global_status_created_tmp_files
-
mysql_global_status_created_tmp_tables
-
mysql_global_status_handlers_total
mysql_global_status_innodb_mem_adaptive_hash
mysql_global_status_innodb_mem_dictionary
-
mysql_global_status_innodb_num_open_files
-
mysql_global_status_innodb_page_size
-
mysql_global_status_max_used_connections
-
mysql_global_status_open_files
-
mysql_global_status_open_table_definitions
-
mysql_global_status_open_tables
-
mysql_global_status_opened_files
-
mysql_global_status_opened_table_definitions
-
mysql_global_status_opened_tables
mysql_global_status_qcache_free_memory
mysql_global_status_qcache_hits
mysql_global_status_qcache_inserts
mysql_global_status_qcache_lowmem_prunes
mysql_global_status_qcache_not_cached
mysql_global_status_qcache_queries_in_cache
-
mysql_global_status_queries
-
mysql_global_status_questions
-
mysql_global_status_select_full_join
-
mysql_global_status_select_full_range_join
-
mysql_global_status_select_range
-
mysql_global_status_select_range_check
-
mysql_global_status_select_scan
-
mysql_global_status_slow_queries
-
mysql_global_status_sort_merge_passes
-
mysql_global_status_sort_range
-
mysql_global_status_sort_rows
-
mysql_global_status_sort_scan
-
mysql_global_status_table_locks_immediate
-
mysql_global_status_table_locks_waited
-
mysql_global_status_table_open_cache_hits
-
mysql_global_status_table_open_cache_misses
-
mysql_global_status_table_open_cache_overflows
-
mysql_global_status_threads_cached
-
mysql_global_status_threads_connected
-
mysql_global_status_threads_created
-
mysql_global_status_threads_running
-
mysql_global_status_uptime
mysql_global_variables_innodb_additional_mem_pool_size
-
mysql_global_variables_innodb_buffer_pool_size
-
mysql_global_variables_innodb_log_buffer_size
-
mysql_global_variables_key_buffer_size
-
mysql_global_variables_max_connections
-
mysql_global_variables_open_files_limit
mysql_global_variables_query_cache_size
-
mysql_global_variables_table_definition_cache
-
mysql_global_variables_table_open_cache
-
mysql_global_variables_thread_cache_size
mysql_global_variables_tokudb_cache_size
mysql_info_schema_threads
topk