MySQL Overview 21,025,67521,025,675 4.3 (11 reviews)
Description
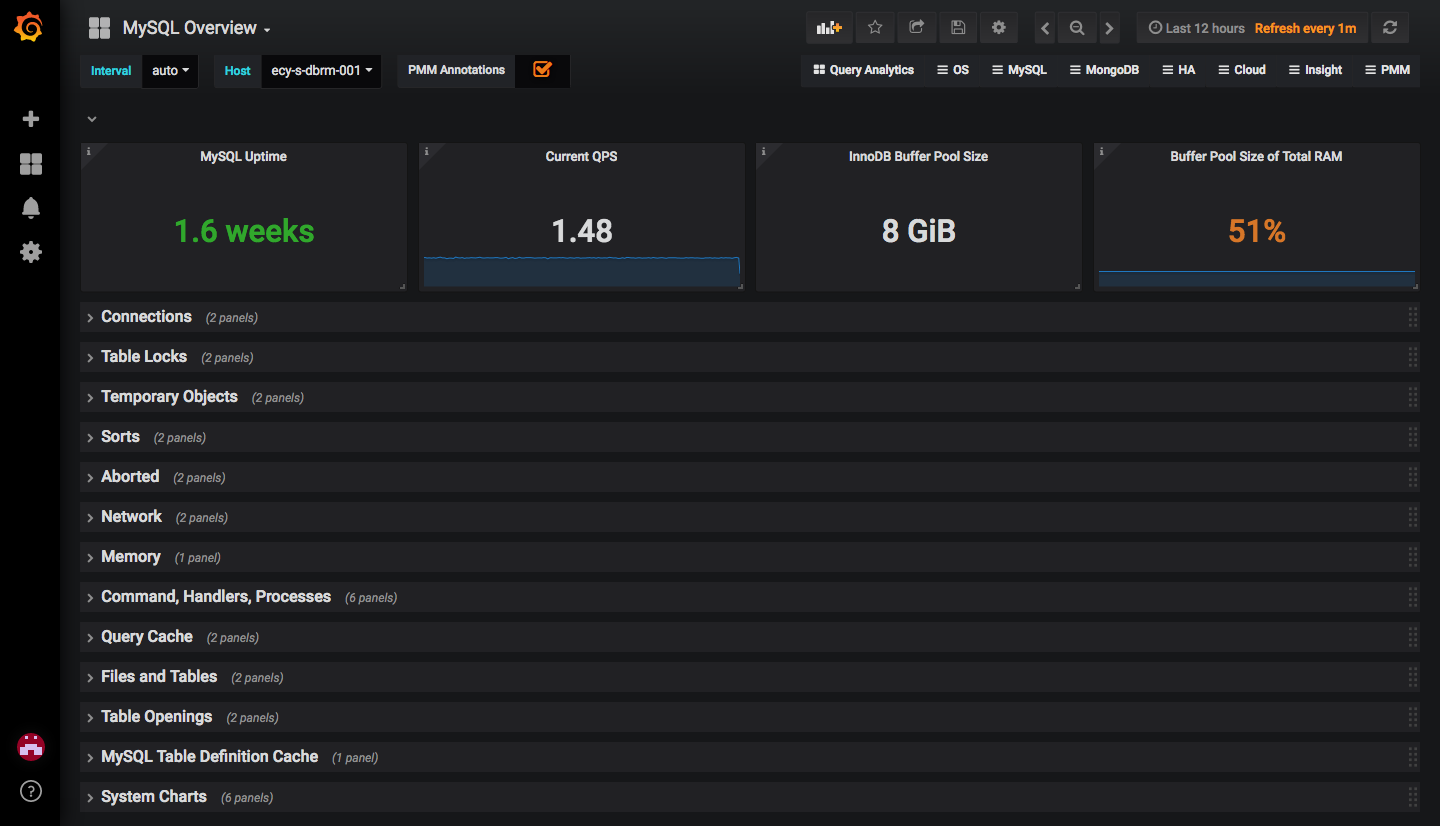
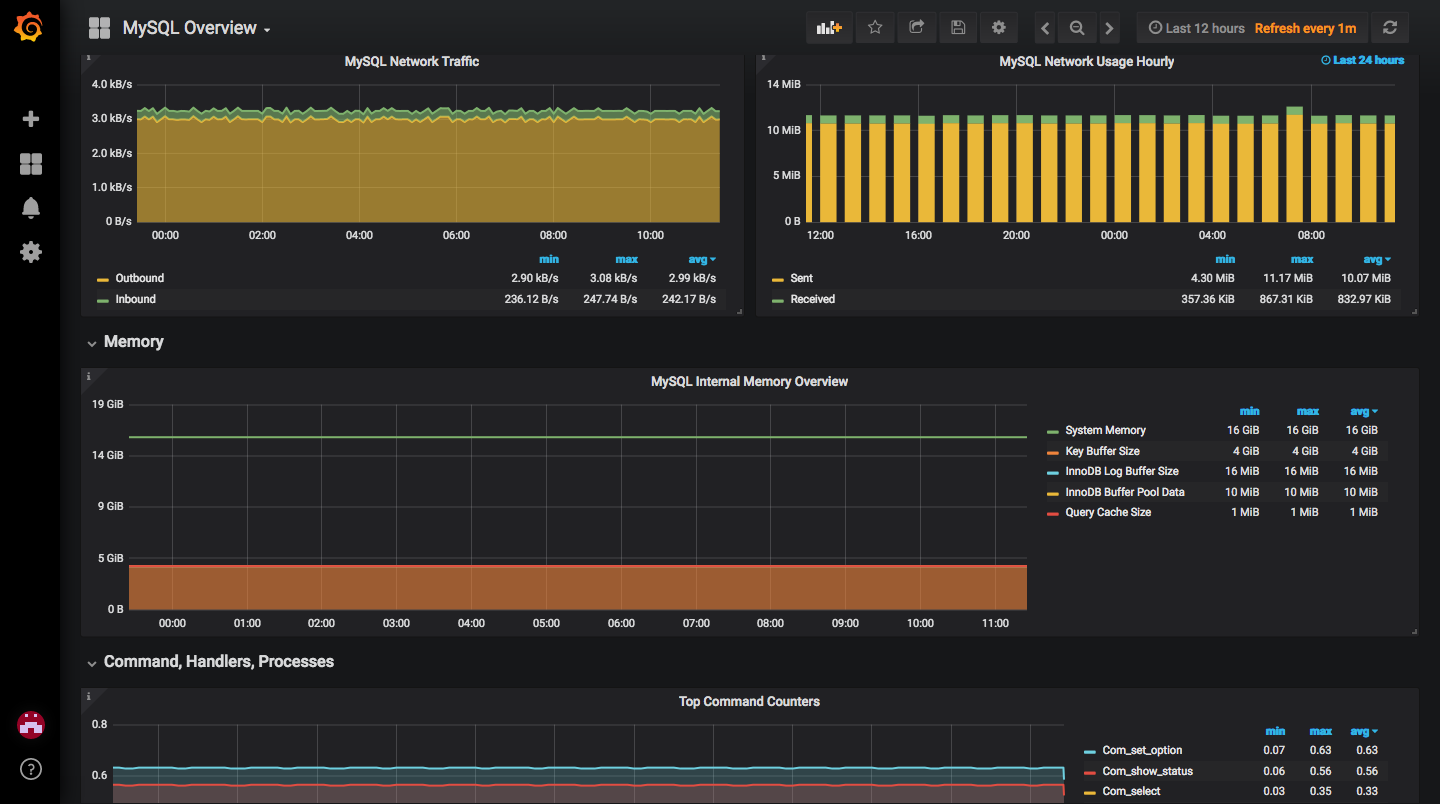
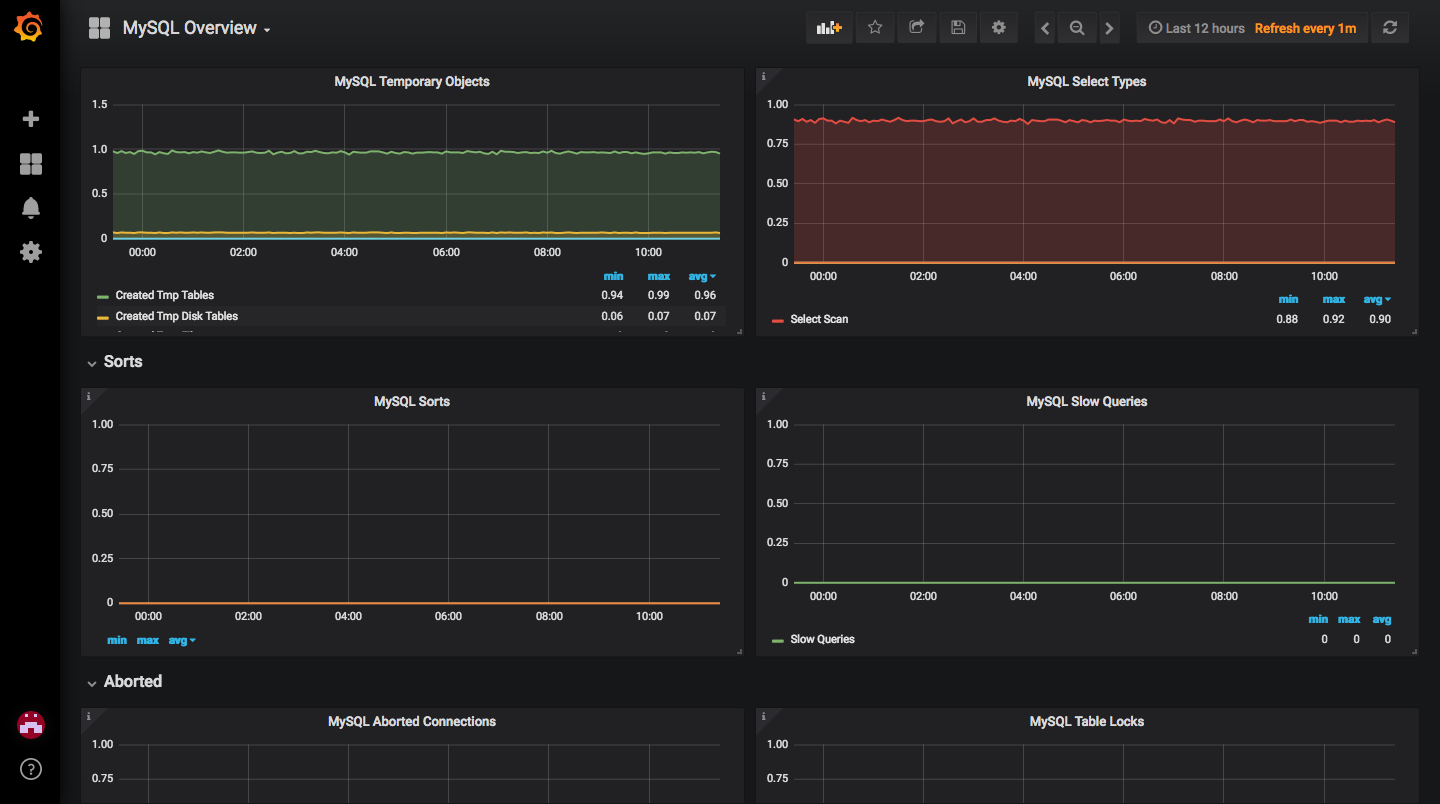
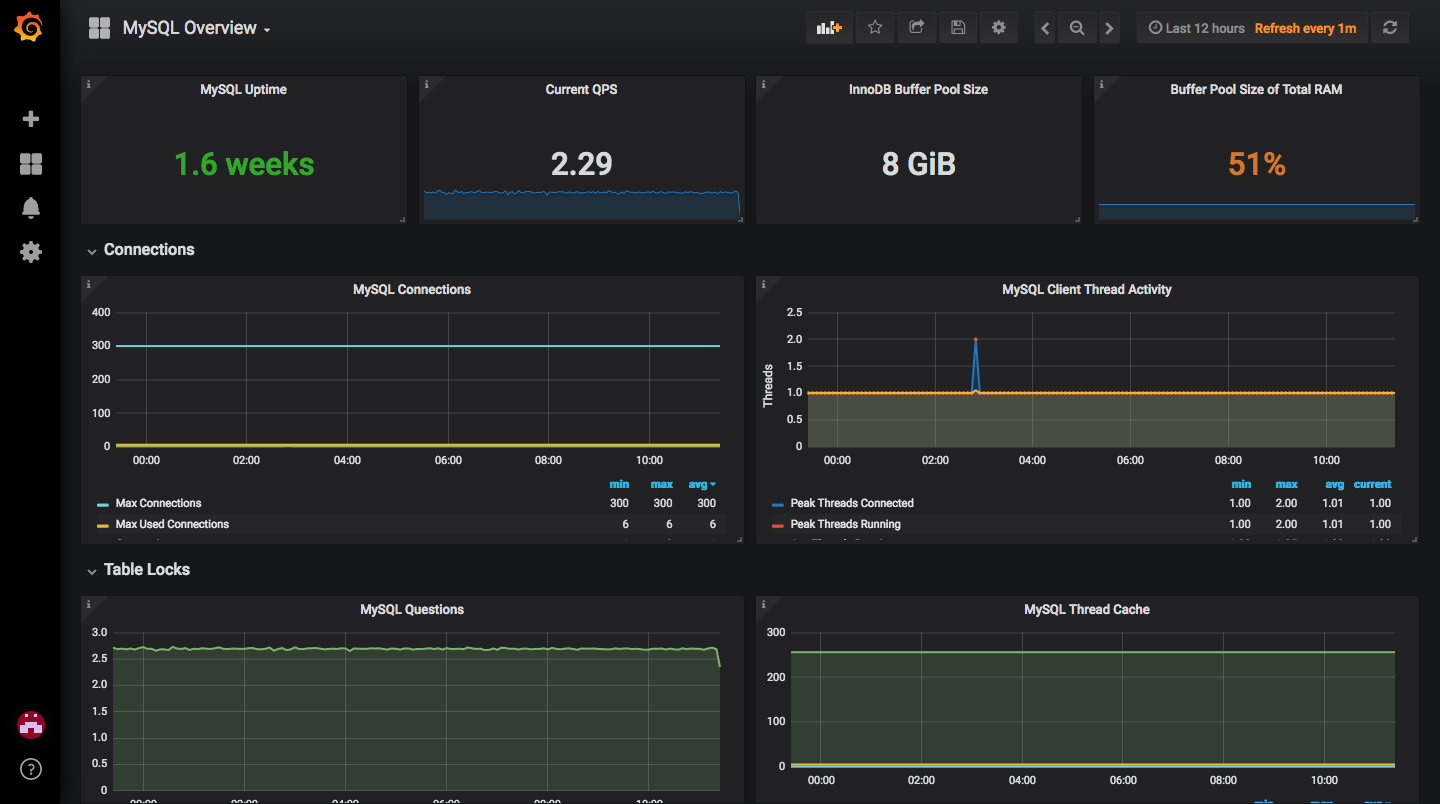
This dashboard provides a comprehensive live view of a MySQL server's health and performance, aggregating global status, configuration, and runtime metrics across multiple panels. Key metrics include mysql_global_status_uptime and mysql_global_status_queries to track availability and query load, while supporting panels cover buffer pool sizing, memory usage, connection activity, thread and cache behavior, slow queries, locks, and network traffic, with hourly breakdowns and top-command counters for deep-dive diagnostics.
Screenshots
Used Metrics 8484
aws_rds_read_latency_average
aws_rds_write_latency_average
interval
-
mysql_global_status_aborted_clients
-
mysql_global_status_aborted_connects
-
mysql_global_status_buffer_pool_pages
-
mysql_global_status_bytes_received
-
mysql_global_status_bytes_sent
-
mysql_global_status_commands_total
-
mysql_global_status_created_tmp_disk_tables
-
mysql_global_status_created_tmp_files
-
mysql_global_status_created_tmp_tables
-
mysql_global_status_handlers_total
mysql_global_status_innodb_mem_adaptive_hash
mysql_global_status_innodb_mem_dictionary
-
mysql_global_status_innodb_num_open_files
-
mysql_global_status_innodb_page_size
-
mysql_global_status_max_used_connections
-
mysql_global_status_open_files
-
mysql_global_status_open_table_definitions
-
mysql_global_status_open_tables
-
mysql_global_status_opened_files
-
mysql_global_status_opened_table_definitions
-
mysql_global_status_opened_tables
mysql_global_status_qcache_free_memory
mysql_global_status_qcache_hits
mysql_global_status_qcache_inserts
mysql_global_status_qcache_lowmem_prunes
mysql_global_status_qcache_not_cached
mysql_global_status_qcache_queries_in_cache
-
mysql_global_status_queries
-
mysql_global_status_questions
-
mysql_global_status_select_full_join
-
mysql_global_status_select_full_range_join
-
mysql_global_status_select_range
-
mysql_global_status_select_range_check
-
mysql_global_status_select_scan
-
mysql_global_status_slow_queries
-
mysql_global_status_sort_merge_passes
-
mysql_global_status_sort_range
-
mysql_global_status_sort_rows
-
mysql_global_status_sort_scan
-
mysql_global_status_table_locks_immediate
-
mysql_global_status_table_locks_waited
-
mysql_global_status_table_open_cache_hits
-
mysql_global_status_table_open_cache_misses
-
mysql_global_status_table_open_cache_overflows
-
mysql_global_status_threads_cached
-
mysql_global_status_threads_connected
-
mysql_global_status_threads_created
-
mysql_global_status_threads_running
-
mysql_global_status_uptime
mysql_global_variables_innodb_additional_mem_pool_size
-
mysql_global_variables_innodb_buffer_pool_size
-
mysql_global_variables_innodb_log_buffer_size
-
mysql_global_variables_key_buffer_size
-
mysql_global_variables_max_connections
-
mysql_global_variables_open_files_limit
mysql_global_variables_query_cache_size
-
mysql_global_variables_table_definition_cache
-
mysql_global_variables_table_open_cache
-
mysql_global_variables_thread_cache_size
mysql_global_variables_tokudb_cache_size
mysql_info_schema_threads
-
node_cpu_seconds_total
node_cpu_seconds_total_average
-
node_disk_read_time_seconds_total
-
node_disk_reads_completed_total
-
node_disk_write_time_seconds_total
-
node_disk_writes_completed_total
-
node_load1
node_memory_Buffers
node_memory_Cached
-
node_memory_MemFree_bytes
-
node_memory_MemTotal_bytes
-
node_network_receive_bytes_total
-
node_network_transmit_bytes_total
-
node_vmstat_pgpgin
-
node_vmstat_pgpgout
-
node_vmstat_pswpin
-
node_vmstat_pswpout
rdsosmetrics_network_rx
rdsosmetrics_network_tx
topk