Node Exporter from Agent Integration 117,140117,140
Description
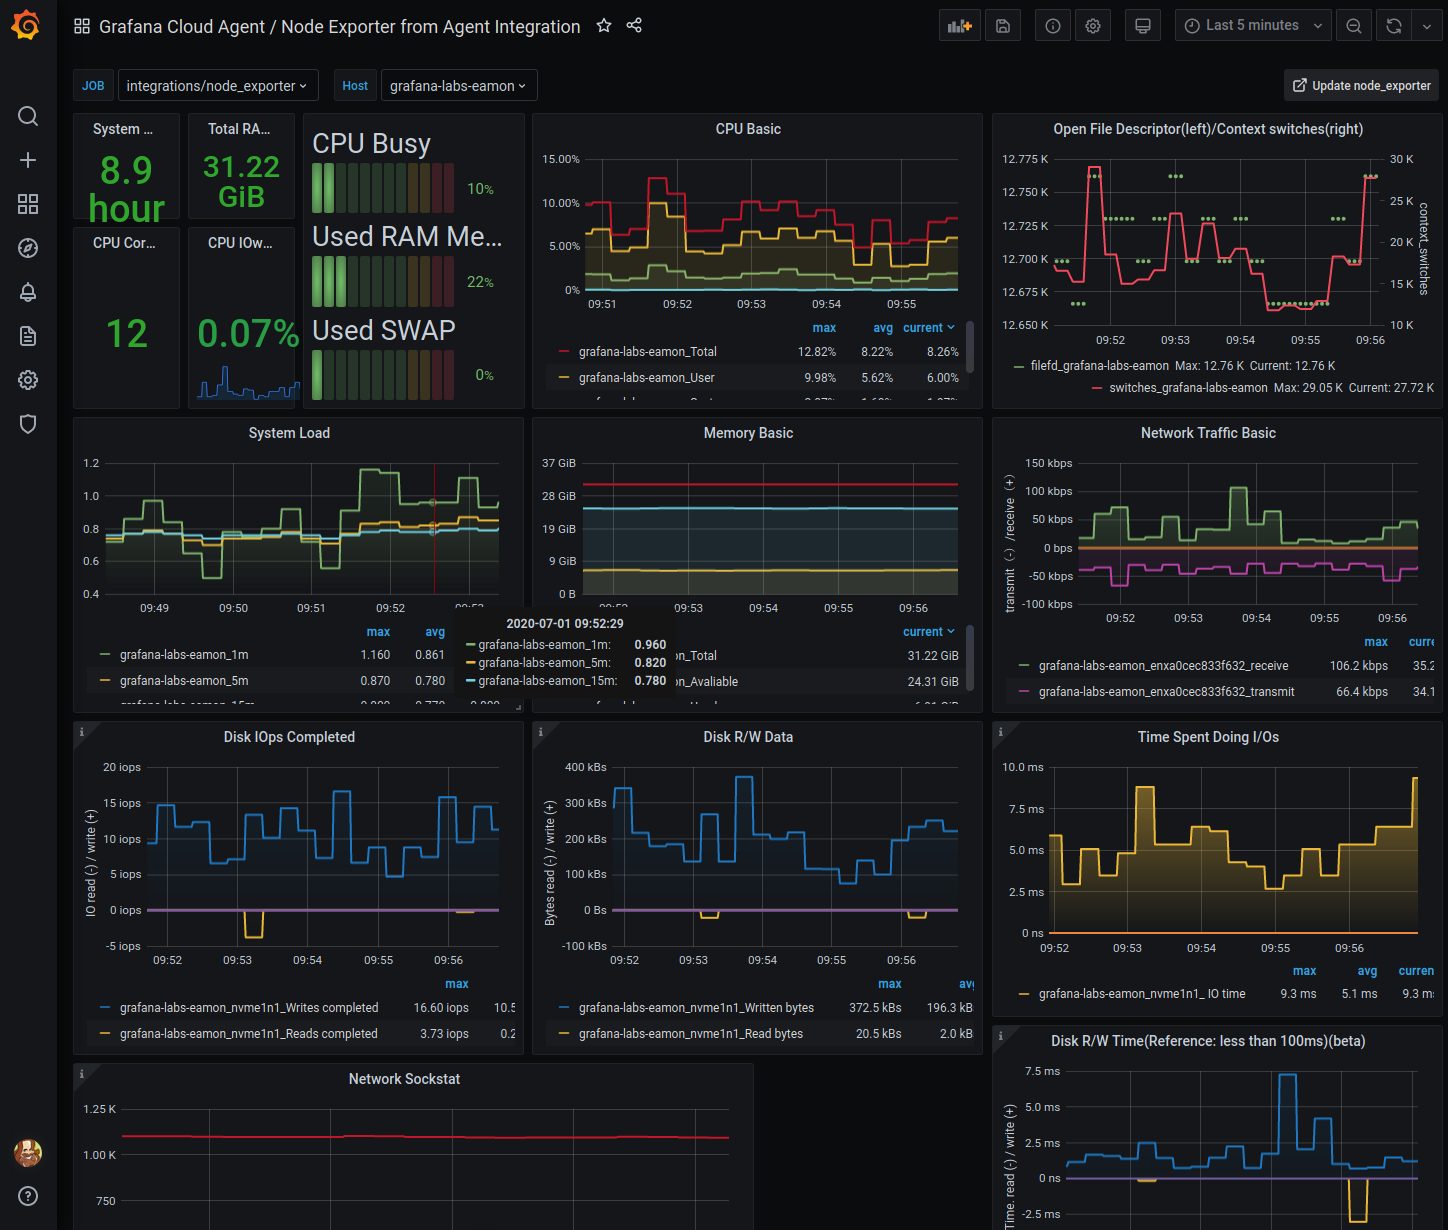
This dashboard monitors node-level system health and performance using Prometheus metrics collected via a Node Exporter agent. It highlights core indicators such as uptime (node_boot_time_seconds), memory (node_memory_MemTotal_bytes, node_memory_MemAvailable_bytes), and CPU activity (node_cpu_seconds_total), along with contextual panels for file descriptors, context switches, and disk I/O. Key features include per-component views (CPU, memory, disk, network) with baseline references (e.g., I/O wait, time spent doing I/Os) and compatibility notes for VM environments where certain hardware metrics may not display.
Screenshots
Used Metrics 2929
-
node_boot_time_seconds
-
node_context_switches_total
-
node_cpu_seconds_total
-
node_disk_io_time_seconds_total
-
node_disk_read_bytes_total
-
node_disk_read_time_seconds_total
-
node_disk_reads_completed_total
-
node_disk_write_time_seconds_total
-
node_disk_writes_completed_total
-
node_disk_written_bytes_total
-
node_filefd_allocated
-
node_filefd_maximum
-
node_filesystem_avail_bytes
-
node_filesystem_size_bytes
node_hwmon_temp_celsius
-
node_load1
-
node_load15
-
node_load5
-
node_memory_MemAvailable_bytes
-
node_memory_MemTotal_bytes
-
node_memory_SwapFree_bytes
-
node_memory_SwapTotal_bytes
-
node_netstat_Tcp_CurrEstab
-
node_network_receive_bytes_total
-
node_network_transmit_bytes_total
-
node_sockstat_TCP_alloc
-
node_sockstat_TCP_tw
-
node_sockstat_UDP_inuse
-
node_sockstat_sockets_used