Node Exporter Full 343,574343,574
Description
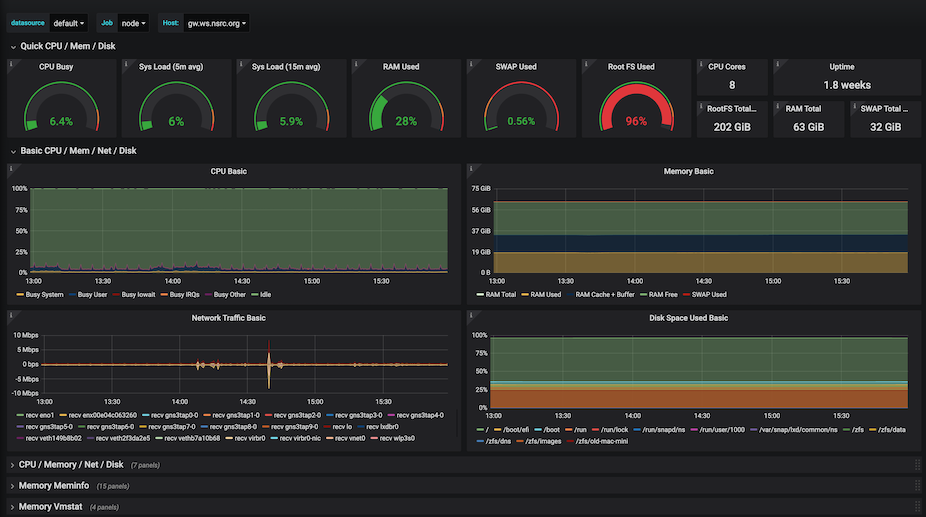
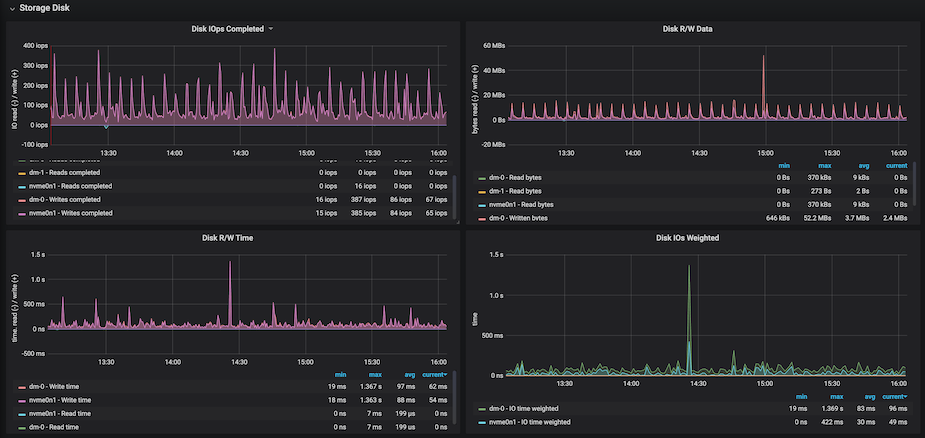
This dashboard provides a comprehensive view of a node’s hardware and I/O performance by aggregating core metrics from the node exporter. It highlights processor utilization and load via node_cpu_seconds_total and node_load5/node_load15, memory status with node_memory_MemTotal_bytes and related free/available metrics, and disk activity trends including Disk IOps, Disk R/W Data and Disk IOs Current in Progress to detect I/O bottlenecks and saturation.
Screenshots
Used Metrics 2626
-
node_boot_time_seconds
-
node_cpu_seconds_total
-
node_disk_discard_time_seconds_total
-
node_disk_discards_completed_total
-
node_disk_discards_merged_total
-
node_disk_io_now
-
node_disk_io_time_seconds_total
-
node_disk_io_time_weighted_seconds_total
-
node_disk_read_bytes_total
-
node_disk_read_time_seconds_total
-
node_disk_reads_completed_total
-
node_disk_reads_merged_total
-
node_disk_write_time_seconds_total
-
node_disk_writes_completed_total
-
node_disk_writes_merged_total
-
node_disk_written_bytes_total
-
node_filesystem_avail_bytes
-
node_filesystem_size_bytes
-
node_load15
-
node_load5
-
node_memory_MemAvailable_bytes
-
node_memory_MemFree_bytes
-
node_memory_MemTotal_bytes
-
node_memory_SwapFree_bytes
-
node_memory_SwapTotal_bytes
-
node_time_seconds