Node Exporter Full 116,633,309116,633,309 4.9 (78 reviews)
Description
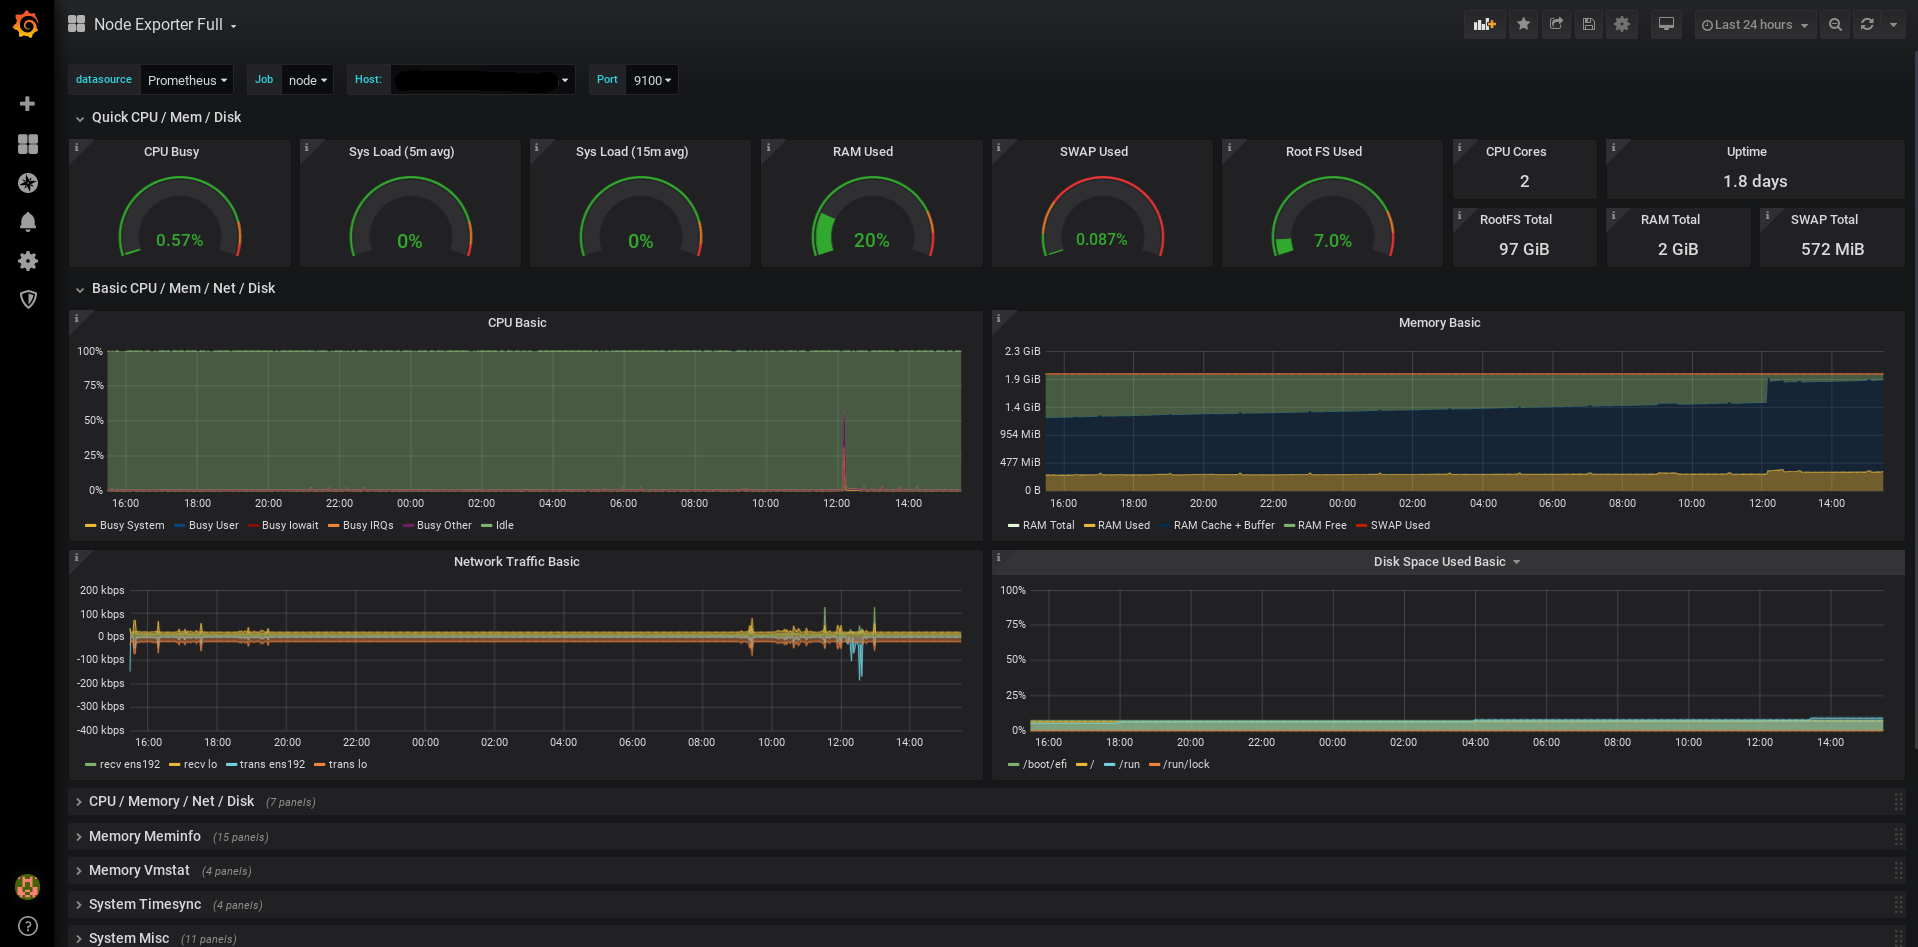
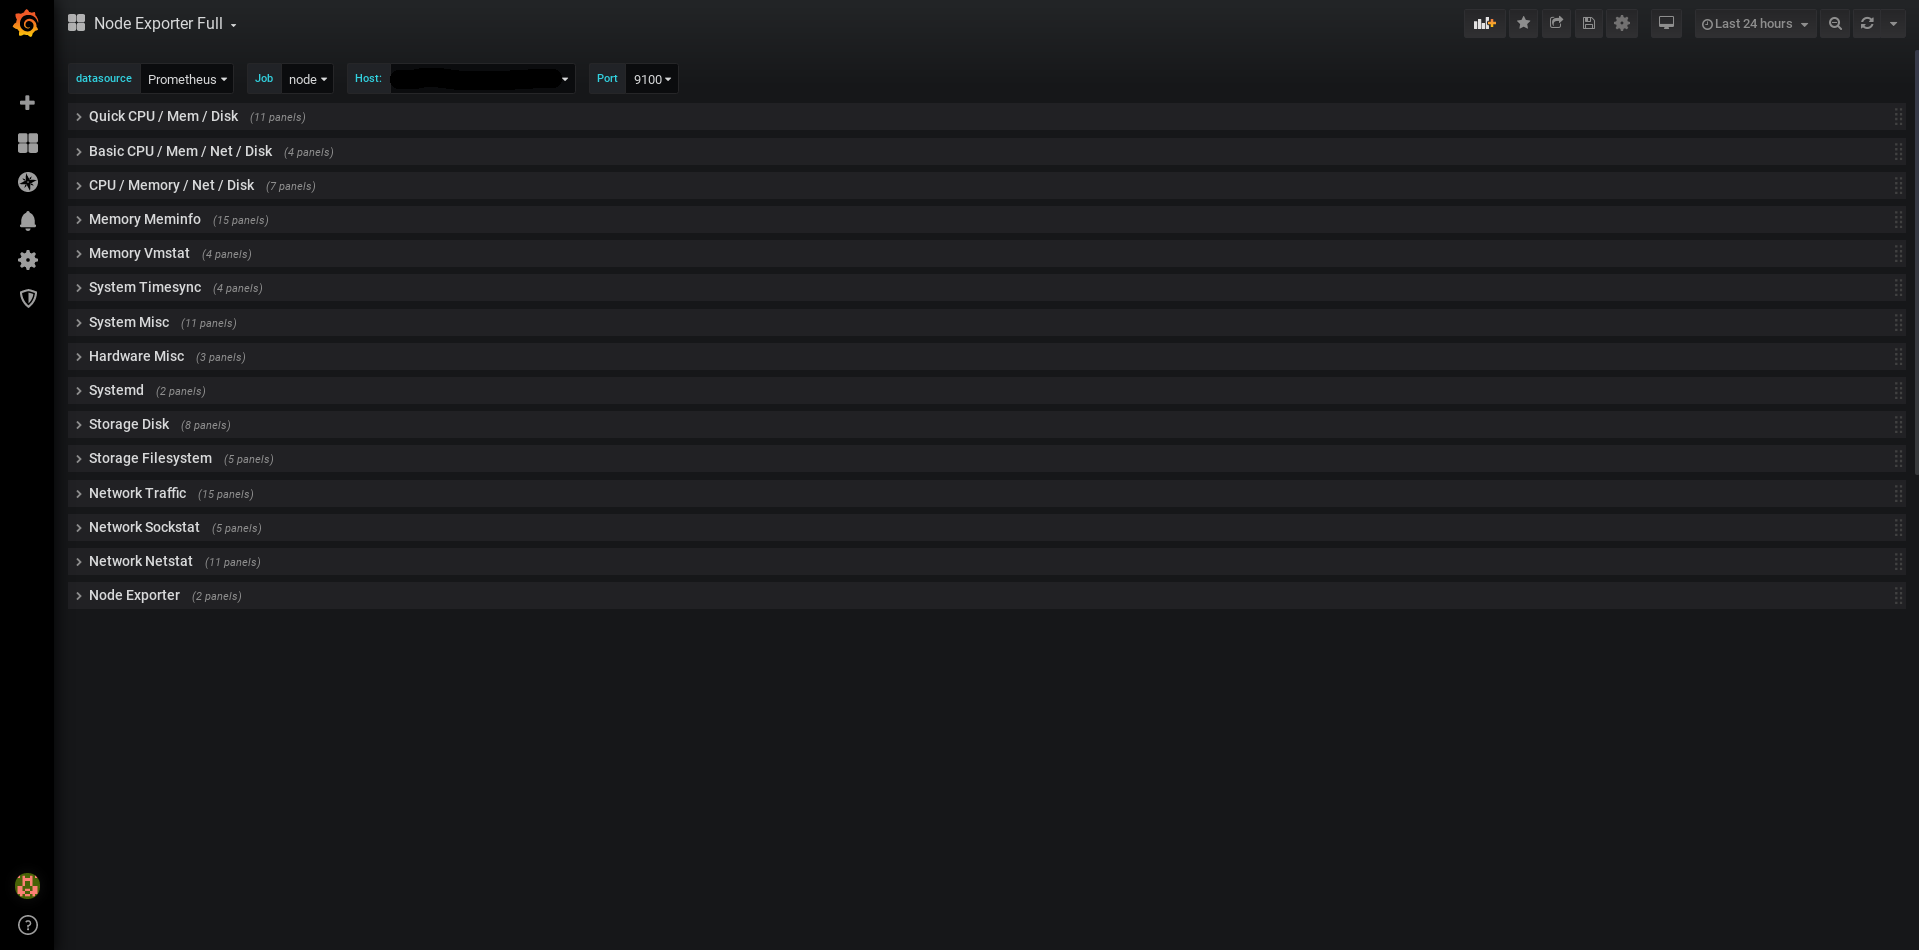
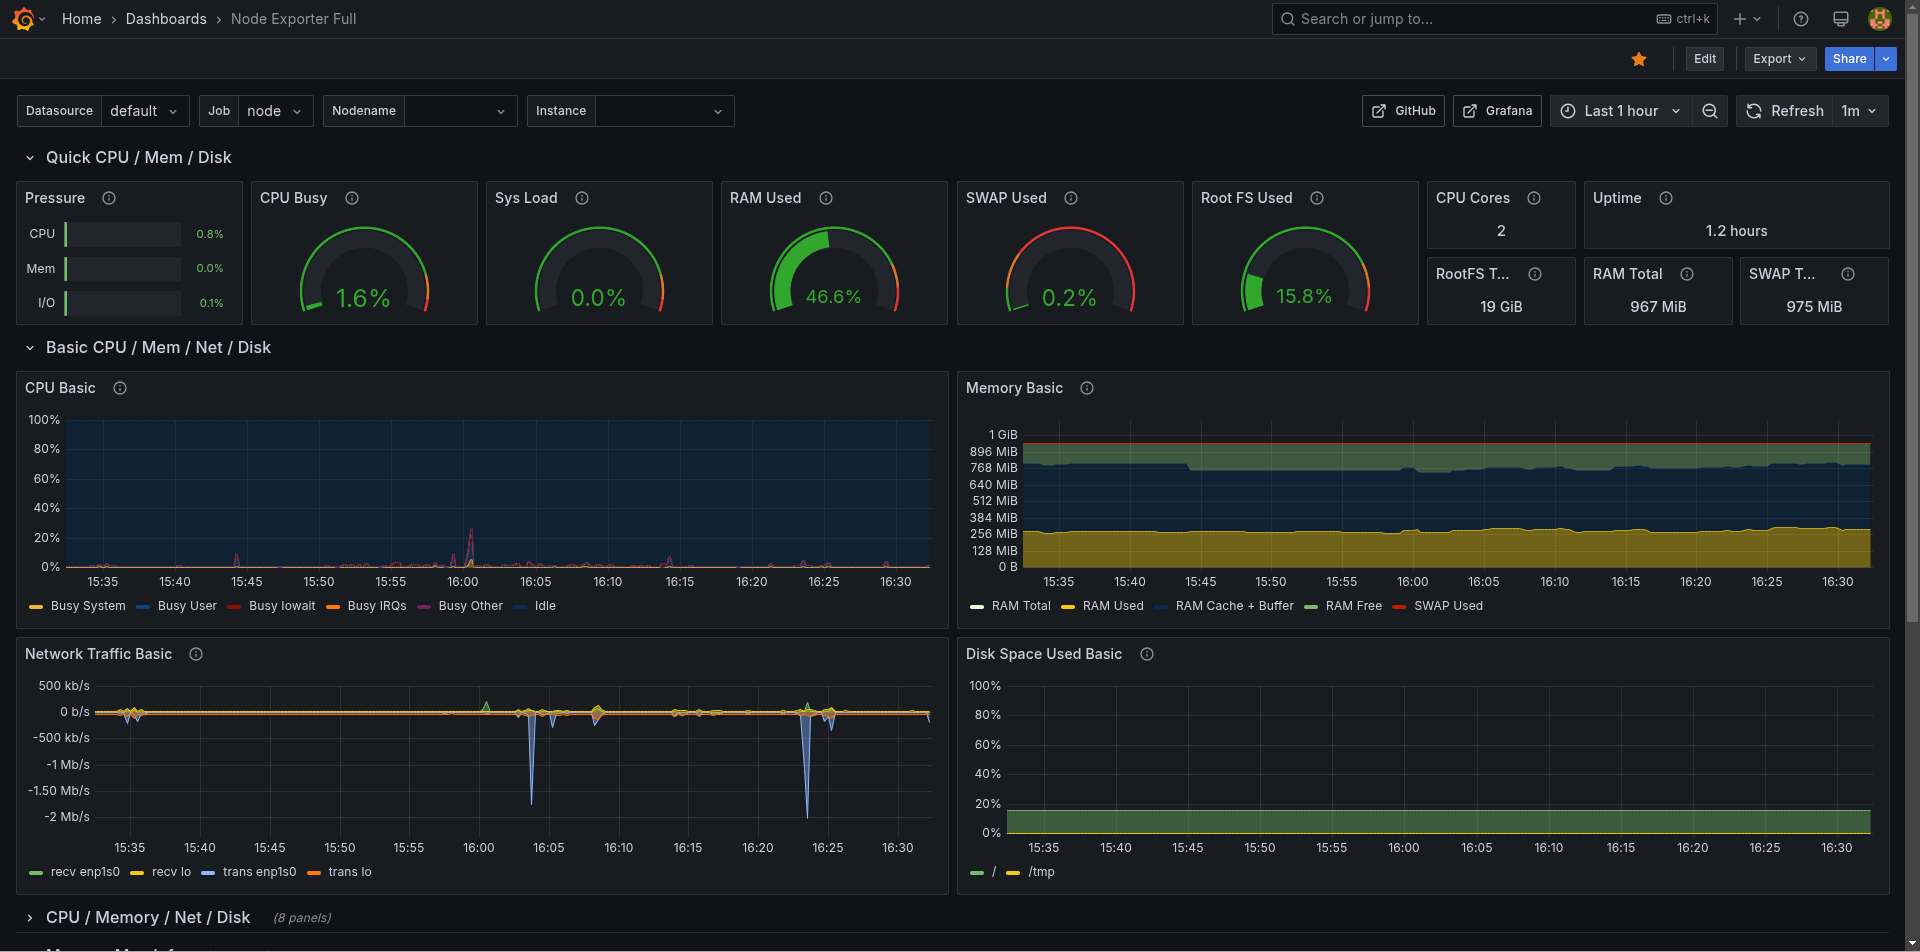
This dashboard provides a comprehensive overview of system metrics including CPU, memory, and disk usage, along with system load and uptime. Key panels display real-time data on CPU pressure, memory availability, swap usage, and disk space, utilizing metrics such as node_cpu_seconds_total and node_memory_MemTotal_bytes. This enables efficient monitoring of hardware resource utilization and system performance, helping identify potential bottlenecks.
Screenshots
Used Metrics 2020
-
node_boot_time_seconds
-
node_cpu_seconds_total
-
node_filesystem_avail_bytes
-
node_filesystem_size_bytes
-
node_load1
-
node_memory_Buffers_bytes
-
node_memory_Cached_bytes
-
node_memory_MemAvailable_bytes
-
node_memory_MemFree_bytes
-
node_memory_MemTotal_bytes
-
node_memory_SReclaimable_bytes
-
node_memory_SwapFree_bytes
-
node_memory_SwapTotal_bytes
-
node_network_receive_bytes_total
-
node_network_transmit_bytes_total
node_pressure_cpu_waiting_seconds_total
node_pressure_io_waiting_seconds_total
node_pressure_irq_stalled_seconds_total
node_pressure_memory_waiting_seconds_total
-
node_time_seconds