NodeJS Application Dashboard 26,868,92826,868,928 4.3 (6 reviews)
Description
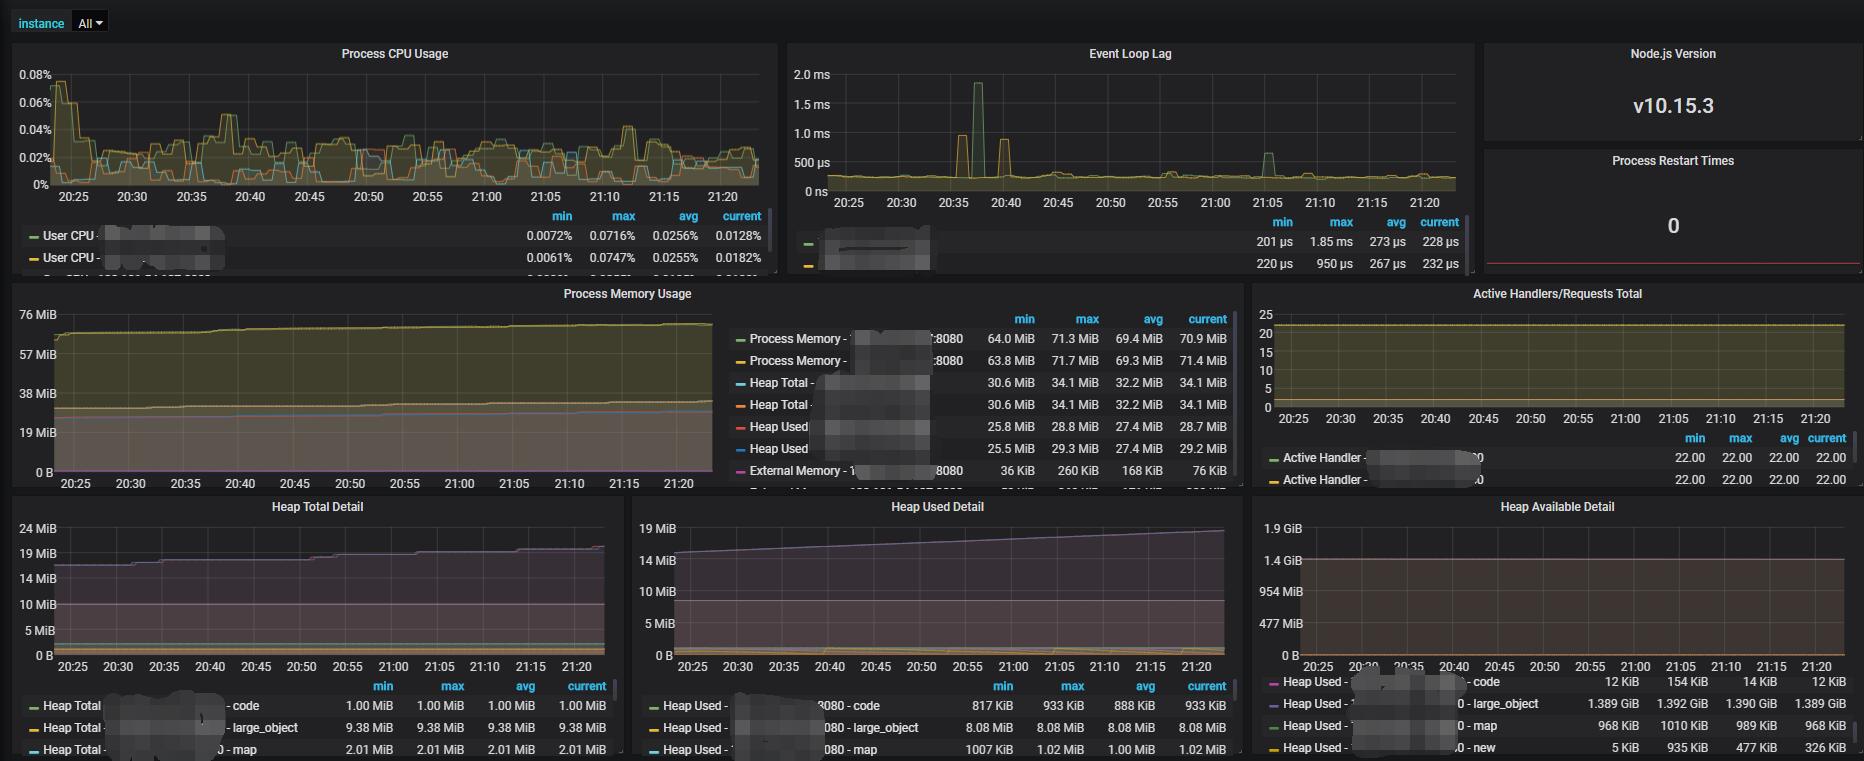
This Node.js dashboard monitors the health and performance of a Node.js application by aggregating runtime metrics such as CPU usage, event loop latency, memory footprint, and heap details, alongside process lifecycle signals like start times and restart events. It provides visibility into active I/O and request activity, memory allocations, and external/native memory, enabling quick detection of bottlenecks or leaks and enabling performance tuning across CPU, memory, and event loop behavior.
Screenshots
Used Metrics 1414
-
nodejs_active_handles_total
-
nodejs_active_requests_total
-
nodejs_eventloop_lag_seconds
-
nodejs_external_memory_bytes
-
nodejs_heap_size_total_bytes
-
nodejs_heap_size_used_bytes
-
nodejs_heap_space_size_available_bytes
-
nodejs_heap_space_size_total_bytes
-
nodejs_heap_space_size_used_bytes
-
nodejs_version_info
-
process_cpu_system_seconds_total
-
process_cpu_user_seconds_total
-
process_resident_memory_bytes
-
process_start_time_seconds