Nodejs Metrics 5,703,8645,703,864
Description
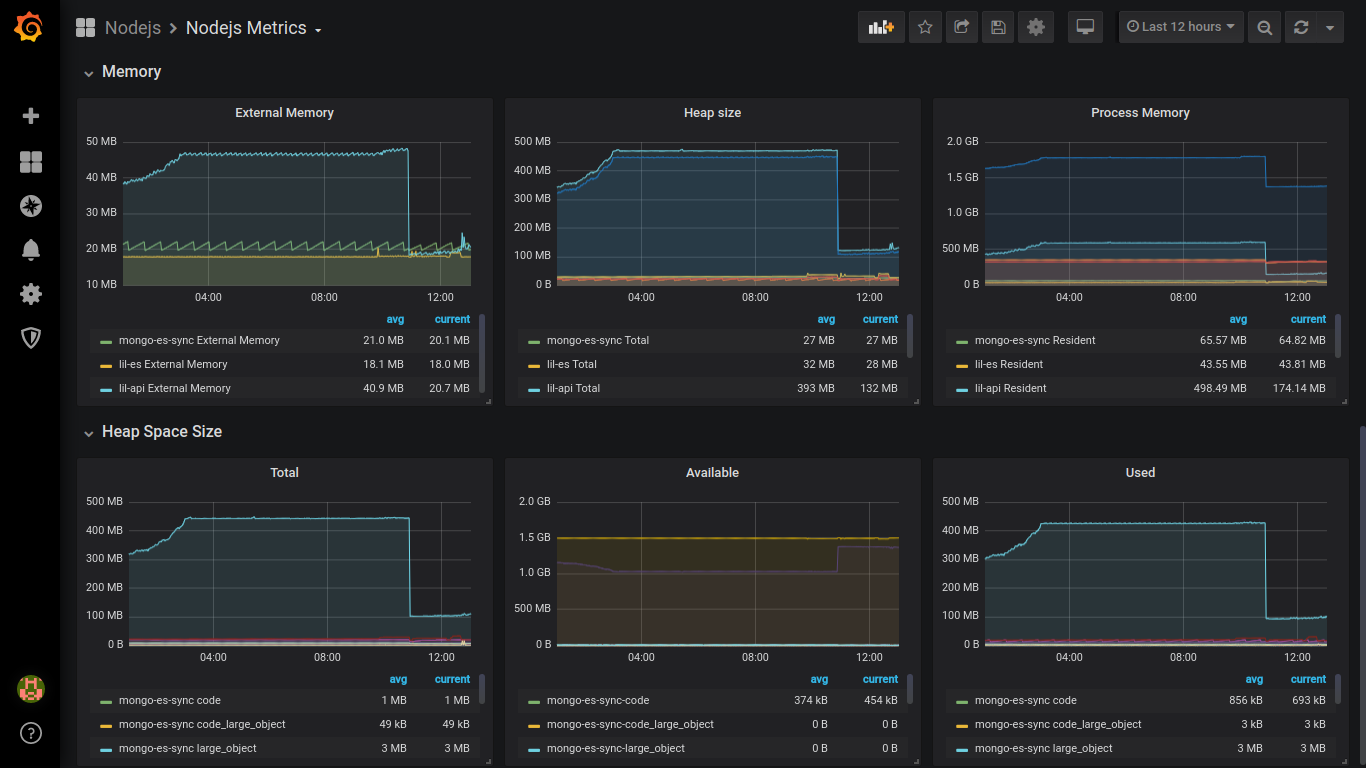
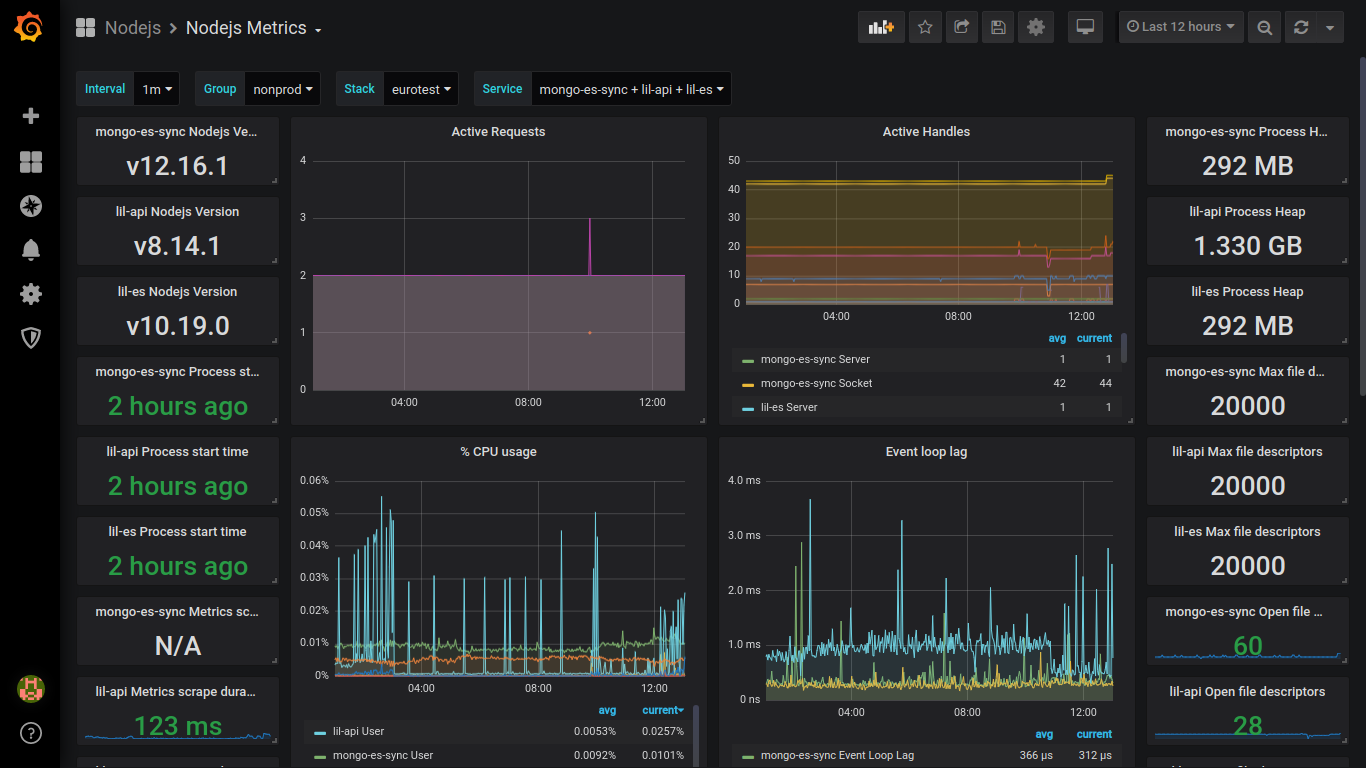
This dashboard monitors Node.js runtime health and resource usage by aggregating key metrics such as nodejs_version_info, nodejs_active_requests (and nodejs_active_requests_total), and process_heap_bytes to give insight into version, request load, and memory dynamics. It presents per-service views (e.g., via $service) for metrics like Event loop lag, Active handles, and Process start time, along with operational indicators such as scrape duration and open file descriptors to help identify performance bottlenecks and resource limits.
Screenshots
Used Metrics 2323
interval
-
nodejs_active_handles
-
nodejs_active_handles_total
-
nodejs_active_requests
-
nodejs_active_requests_total
-
nodejs_eventloop_lag_seconds
-
nodejs_external_memory_bytes
-
nodejs_heap_size_total_bytes
-
nodejs_heap_size_used_bytes
-
nodejs_heap_space_size_available_bytes
-
nodejs_heap_space_size_total_bytes
-
nodejs_heap_space_size_used_bytes
-
nodejs_version_info
-
process_cpu_seconds_total
-
process_cpu_system_seconds_total
-
process_cpu_user_seconds_total
-
process_heap_bytes
-
process_max_fds
-
process_open_fds
-
process_resident_memory_bytes
-
process_start_time_seconds
-
process_virtual_memory_bytes
-
scrape_duration_seconds