Opentelemetry Collector Data Flow 466,924466,924
Description
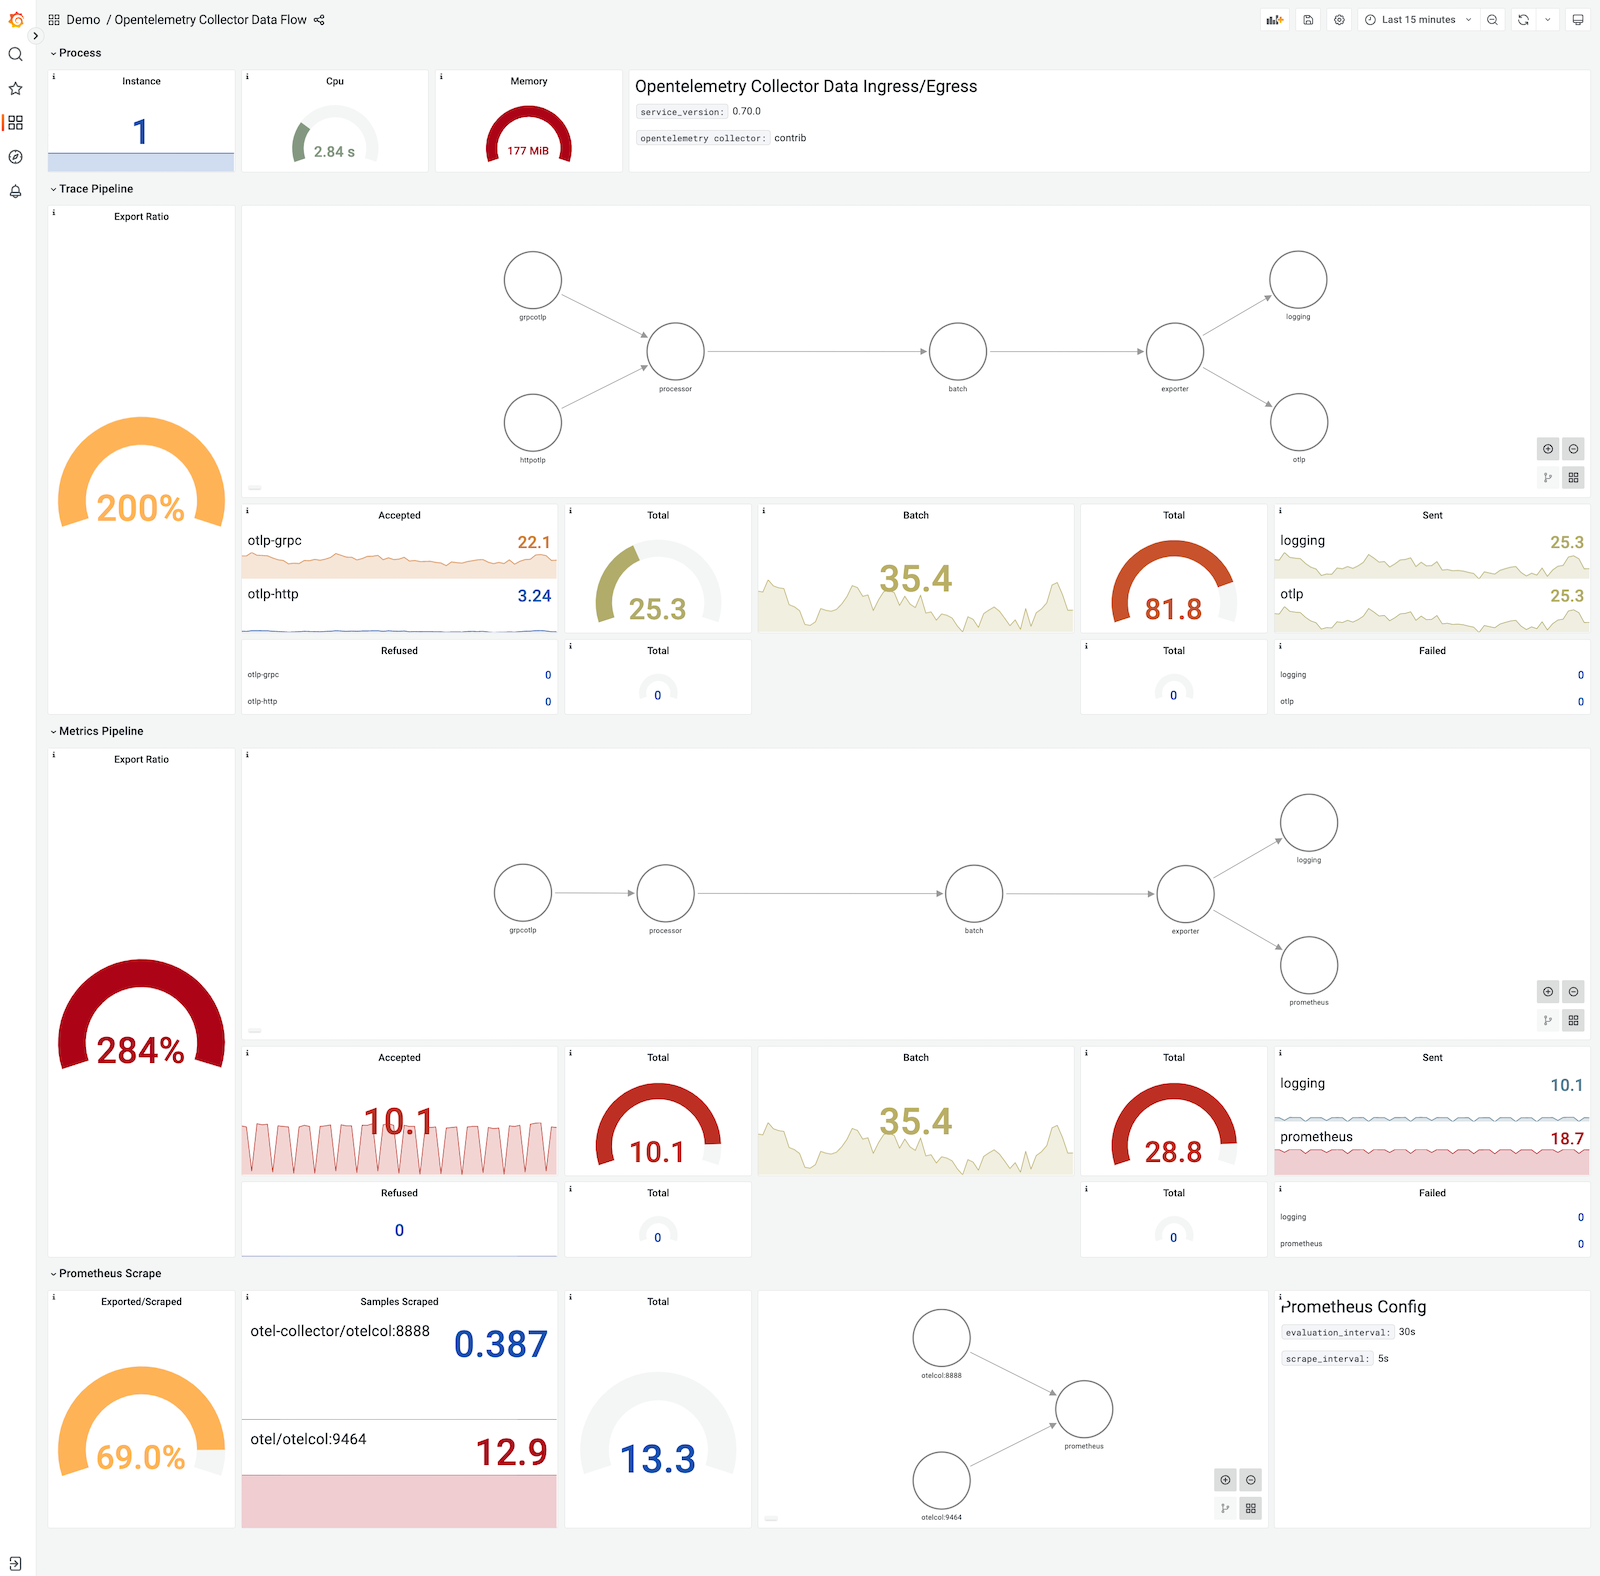
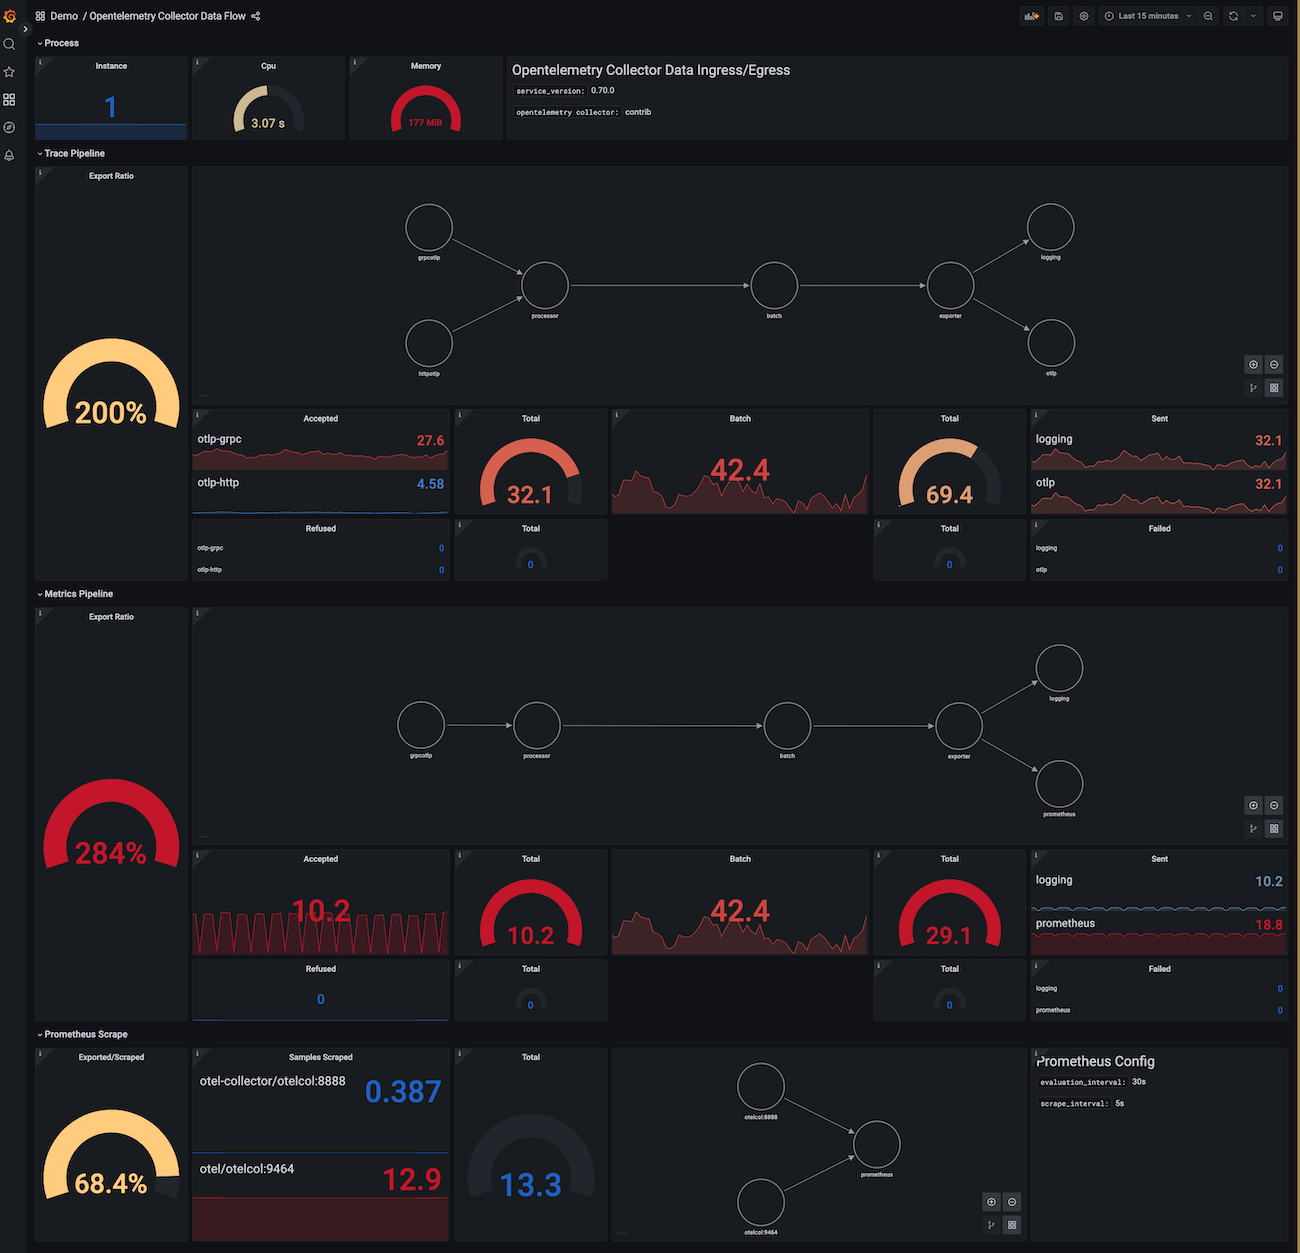
This dashboard monitors the data flow of an OpenTelemetry Collector, focusing on resource usage and throughput across the ingestion and export stages. It highlights per-node metrics such as otelcol_process_cpu_seconds and otelcol_process_memory_rss for system load, export efficiency data through otelcol_exporter_sent_spans and otelcol_receiver_accepted_spans, and flow balance via ingress/egress indicators like batch and total counts to surface bottlenecks in processing or exporting.
Screenshots
Used Metrics 2525
dummynode
exporter
id
instance
mainstat
otelcol_exporter_send_failed_metric_points
otelcol_exporter_send_failed_spans
otelcol_exporter_sent_metric_points
otelcol_exporter_sent_spans
otelcol_process_cpu_seconds
otelcol_process_memory_rss
otelcol_processor_batch_batch_send_size_count
otelcol_processor_batch_batch_send_size_sum
otelcol_receiver_accepted_metric_points
otelcol_receiver_accepted_spans
otelcol_receiver_refused_metric_points
otelcol_receiver_refused_spans
processor
prometheus
receiver
-
scrape_samples_scraped
source
target
title
transport