OpenWRT 1,306,2891,306,289 5.0 (6 reviews)
Description
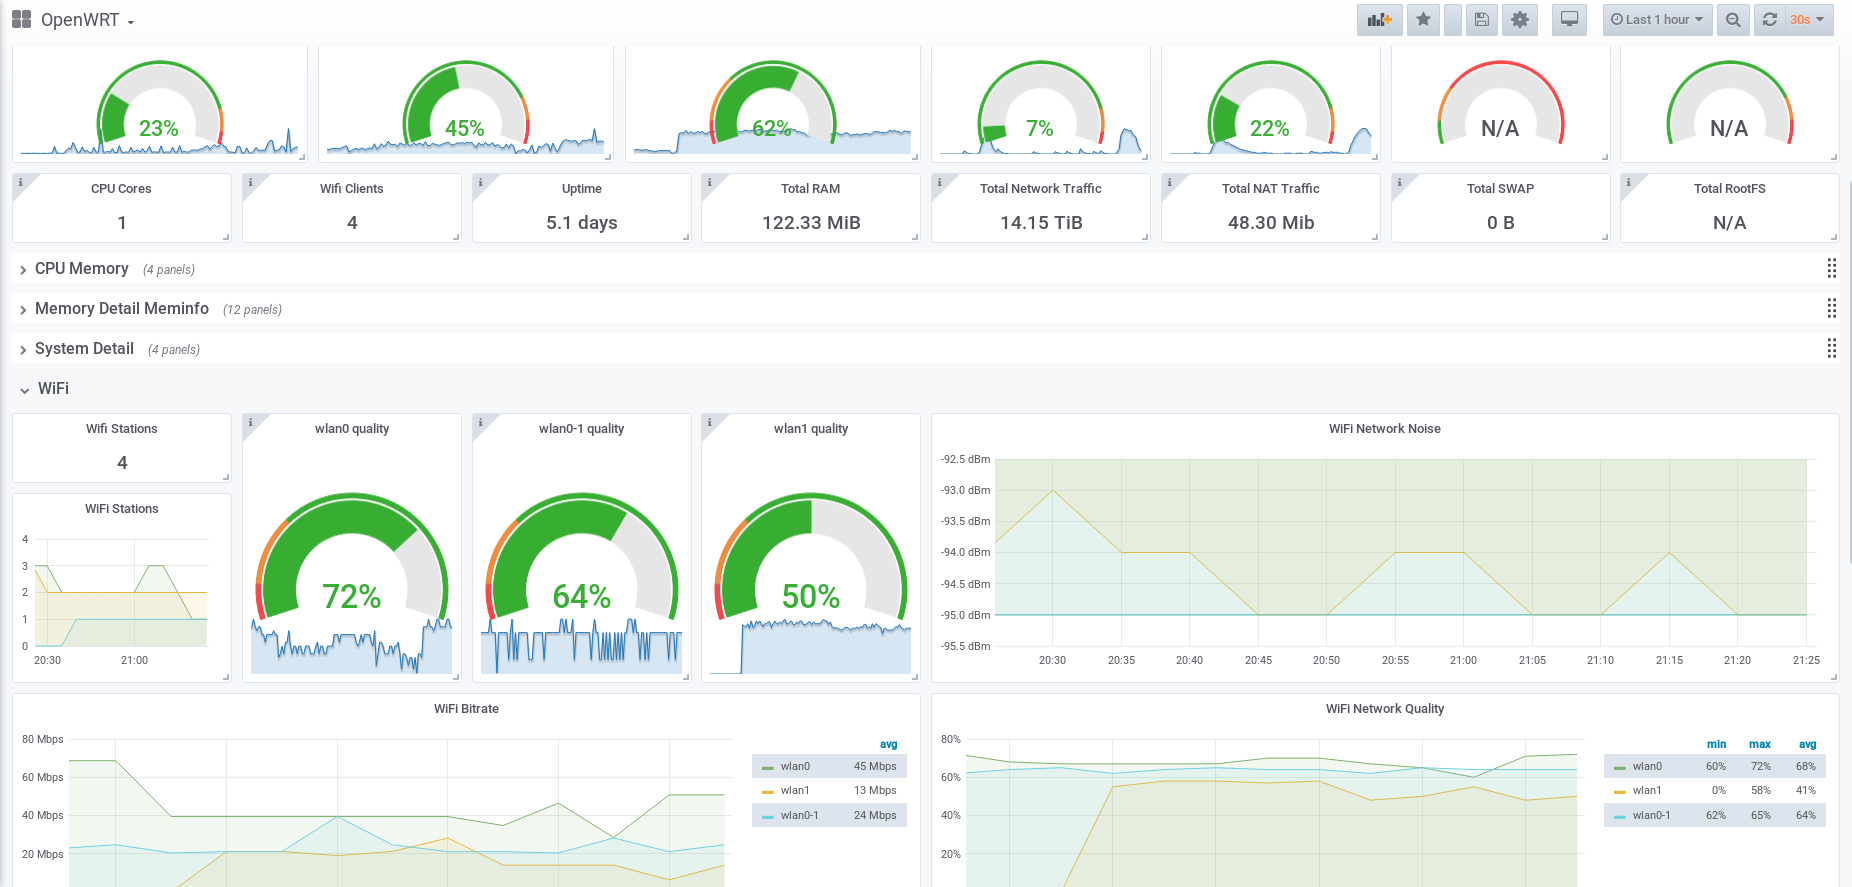
This dashboard monitors an OpenWrt device’s health and resource usage by aggregating system and network metrics. It highlights CPU and memory metrics such as node_cpu_seconds_total and node_memory_MemTotal_bytes, along with live indicators like wifi_network_quality and node_load1/node_load5 to reflect performance under load, while also presenting network traffic and storage metrics such as Transmit Bytes Total and Receive Bytes Total for total usage overview.
Screenshots
Used Metrics 2222
-
node_boot_time_seconds
-
node_cpu_seconds_total
-
node_filesystem_avail_bytes
-
node_filesystem_size_bytes
-
node_load1
-
node_load5
-
node_memory_MemAvailable_bytes
-
node_memory_MemFree_bytes
-
node_memory_MemTotal_bytes
-
node_memory_SwapFree_bytes
-
node_memory_SwapTotal_bytes
node_nat_traffic
-
node_network_receive_bytes_total
-
node_network_receive_packets_total
-
node_network_transmit_bytes_total
-
node_network_transmit_packets_total
node_openwrt_info
-
node_time_seconds
-
node_uname_info
topk
wifi_network_quality
wifi_stations