Opstree/Node Exporter 1,2561,256 3.0 (1 reviews)
2/18/2022
12/20/2022
5
AWSAzureHost Metrics
>=9.0.2
Prometheus
Description
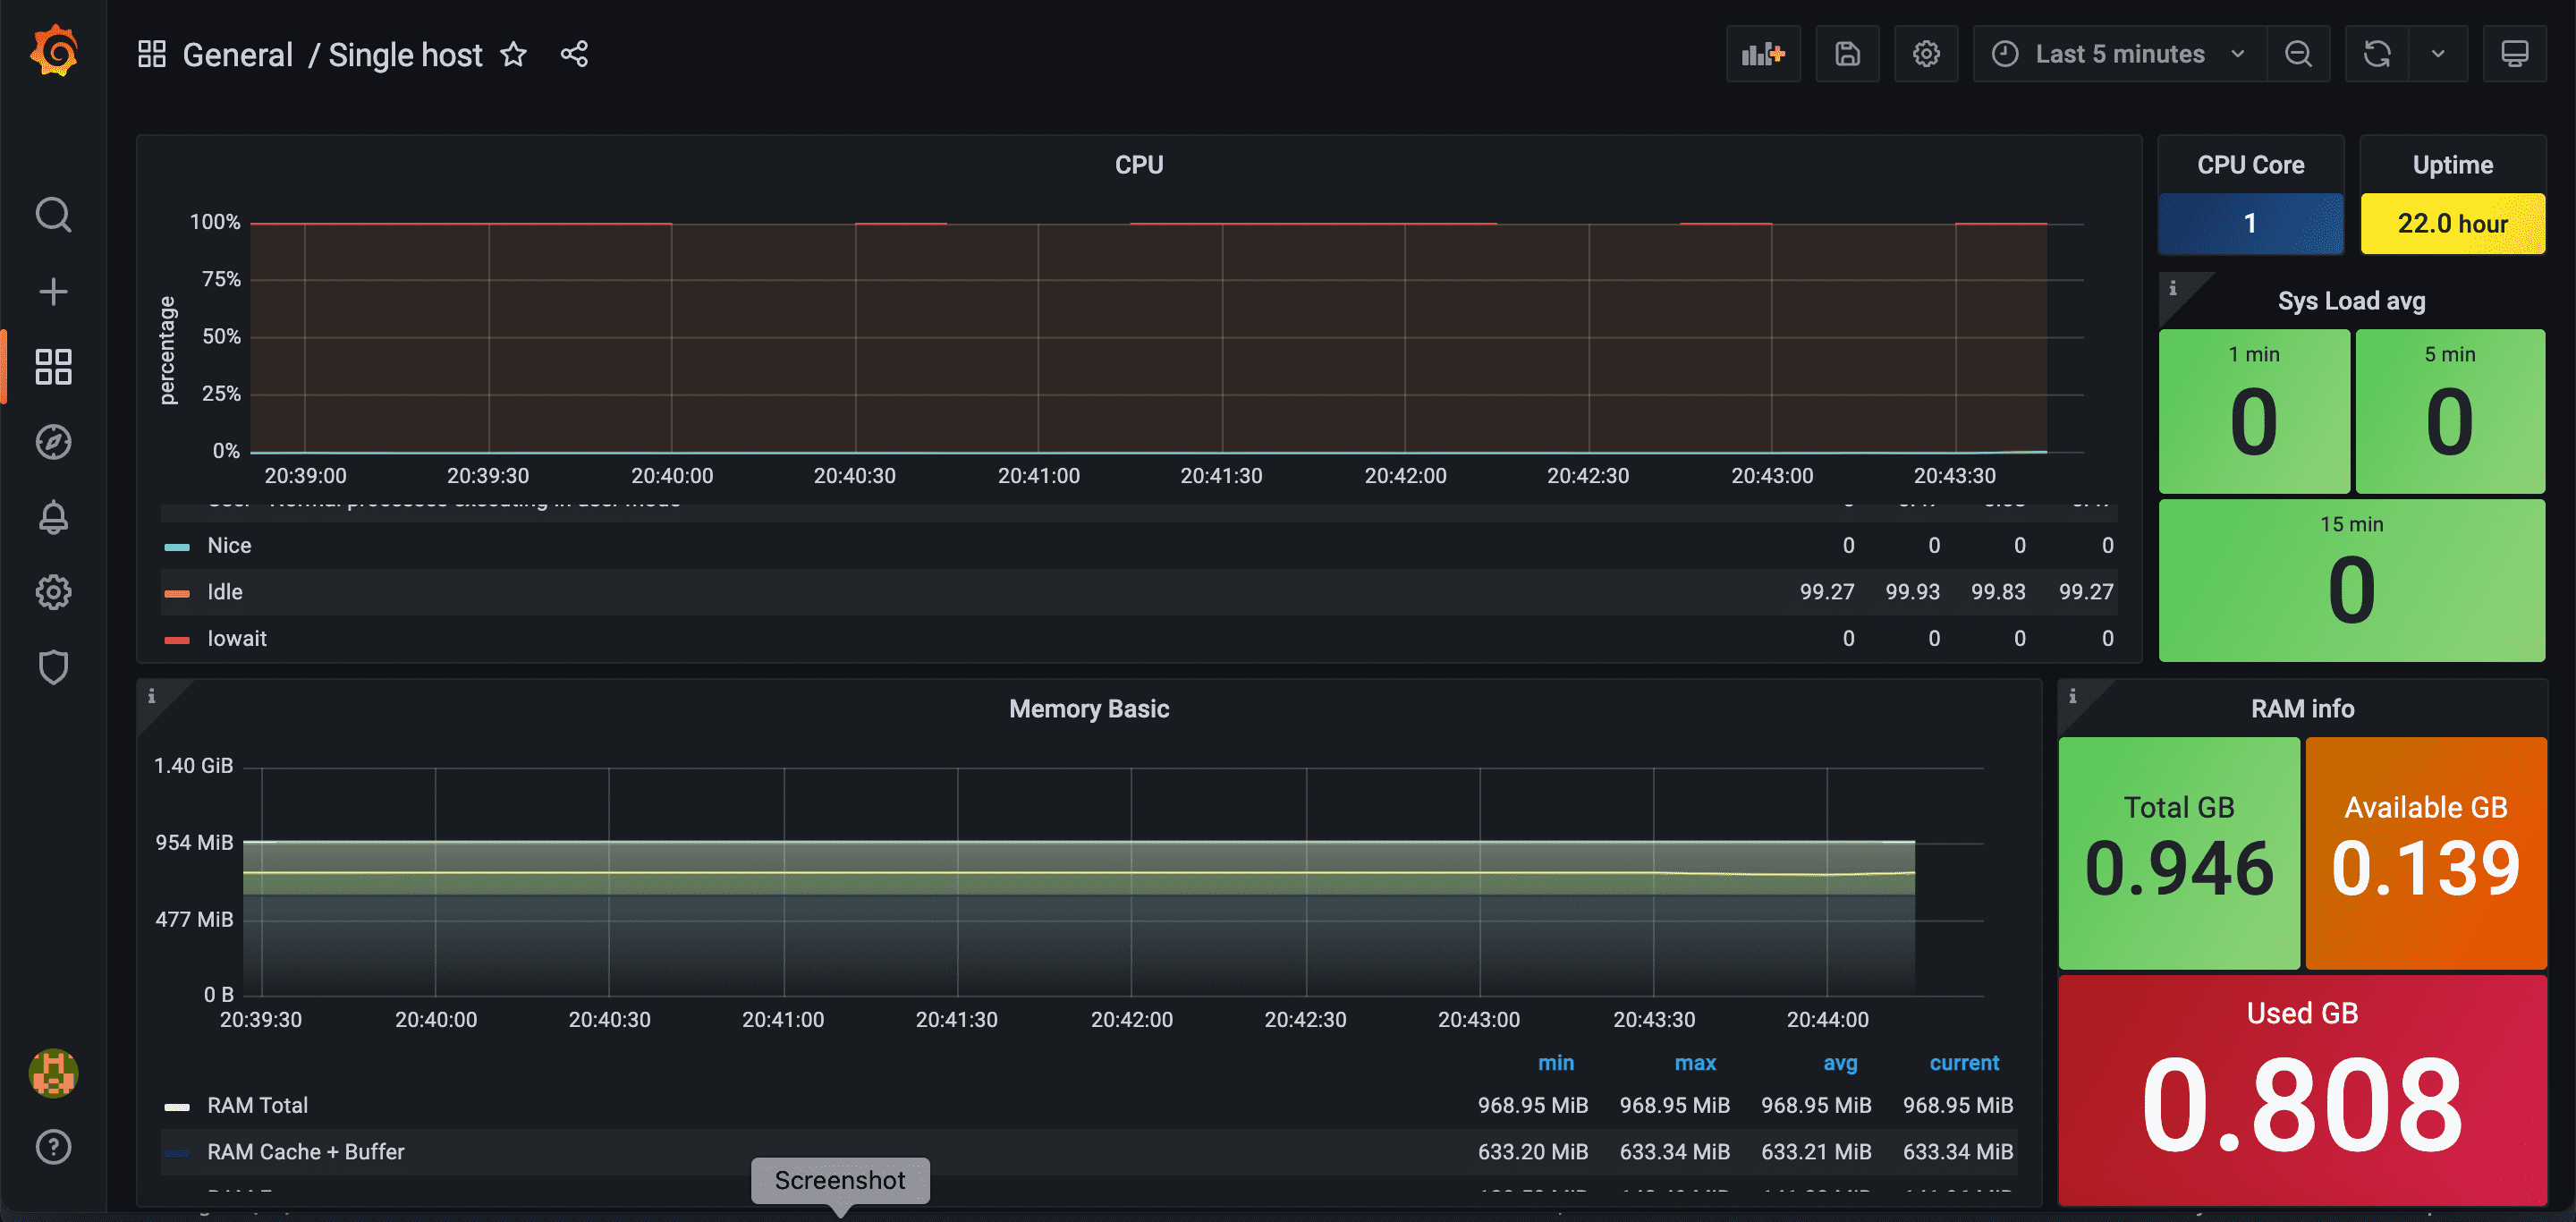
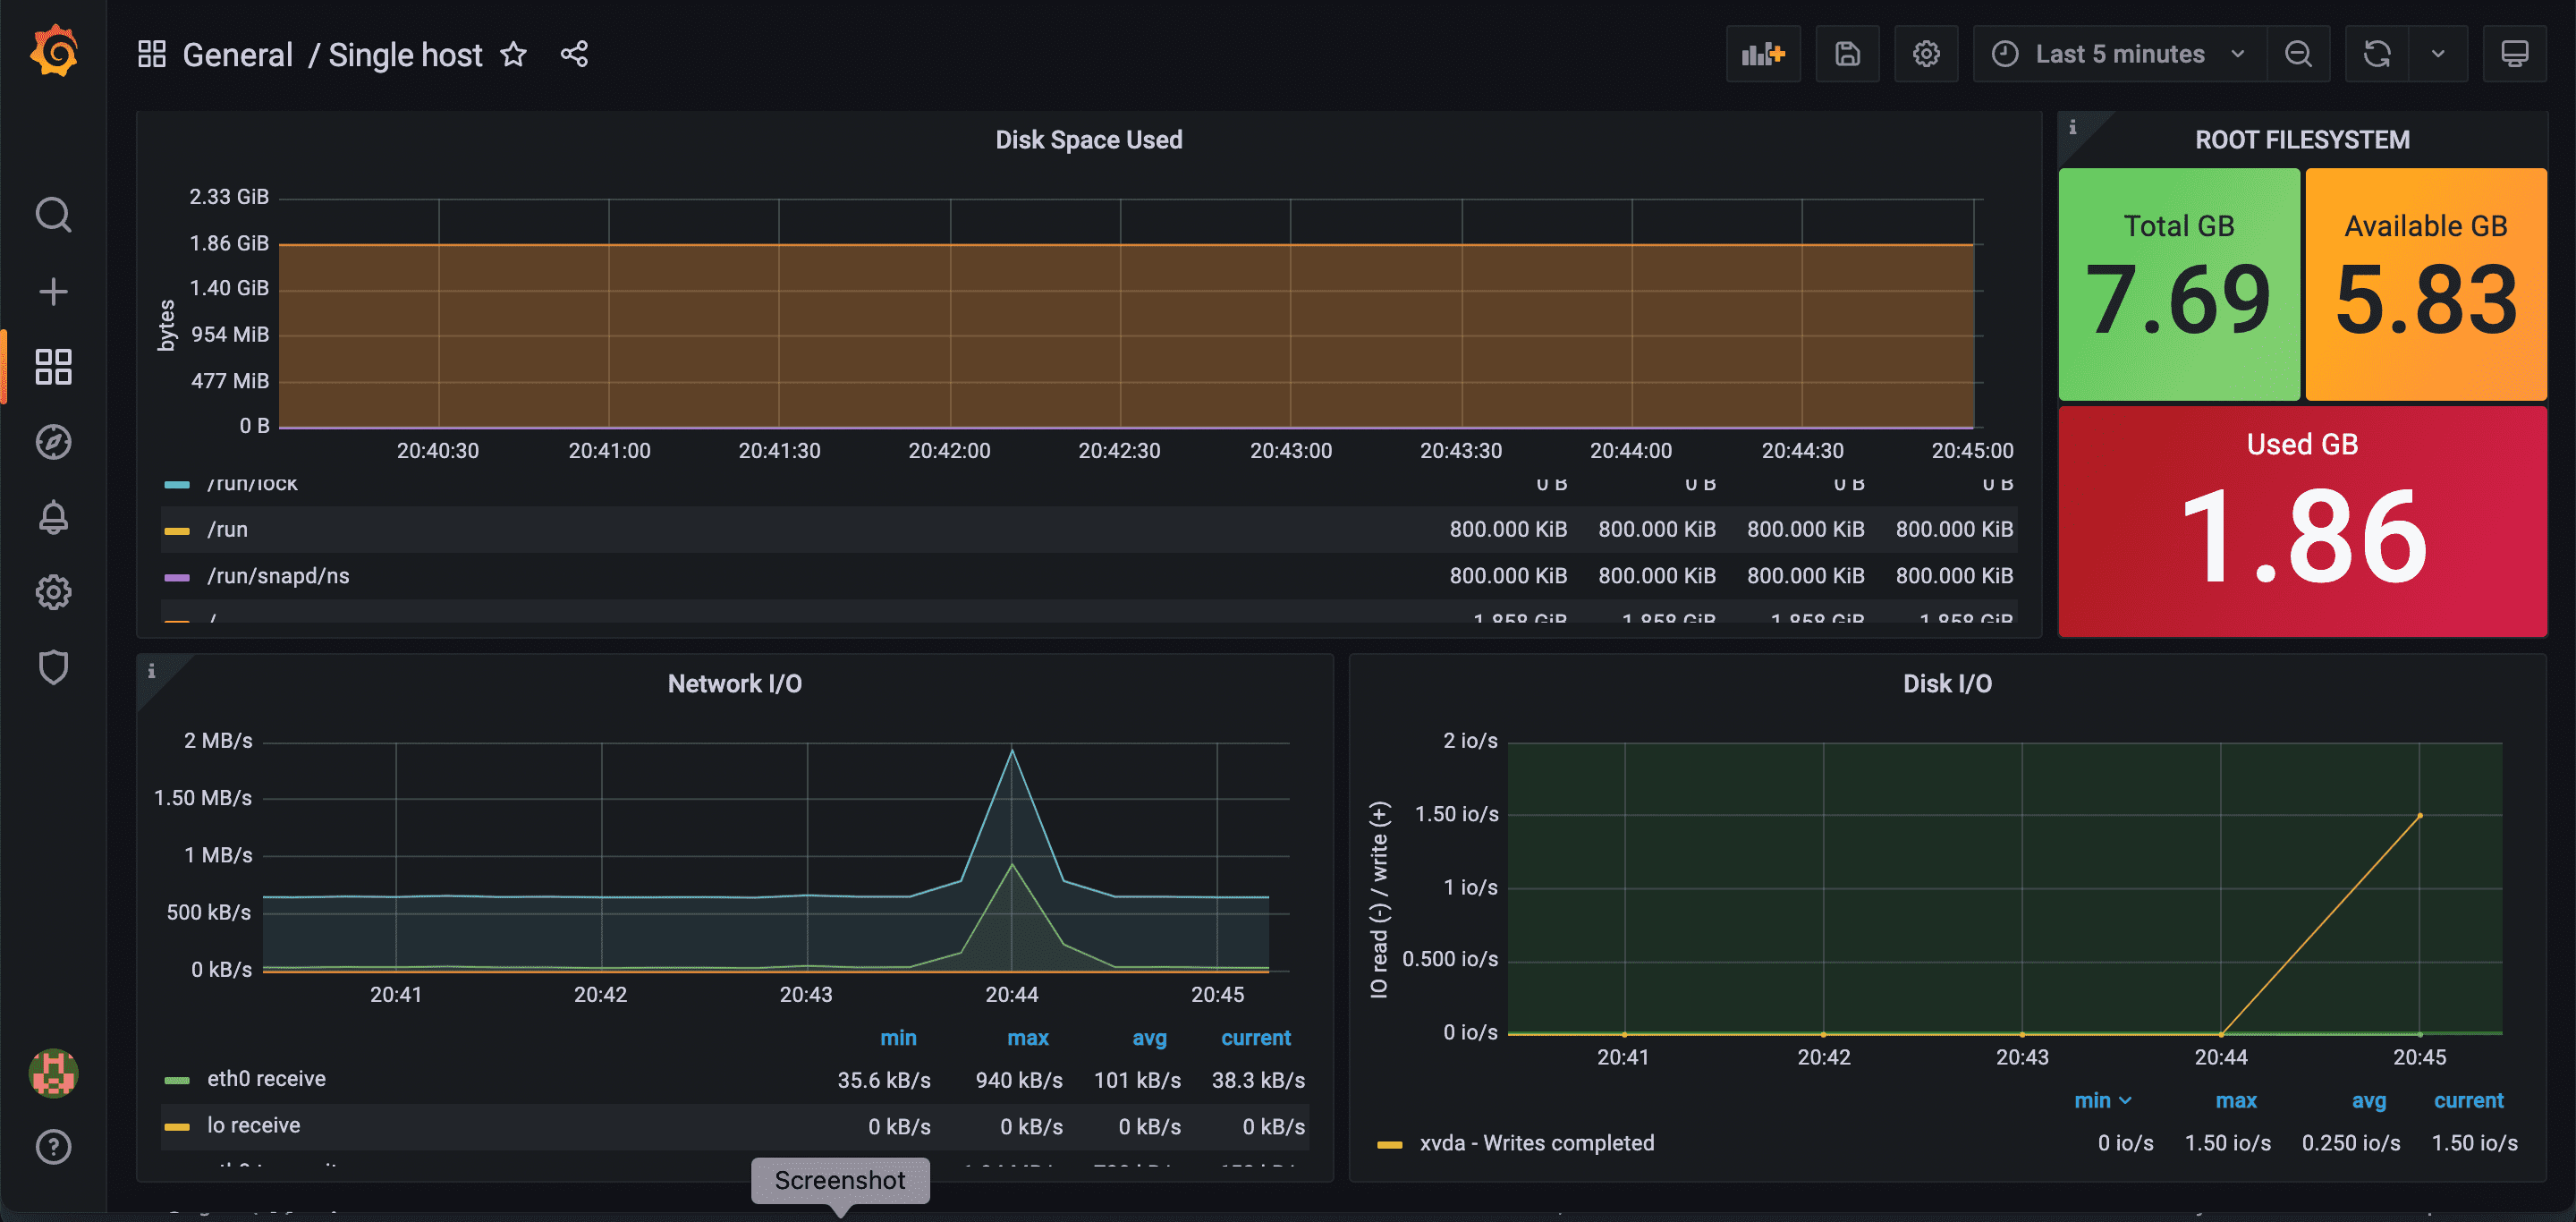
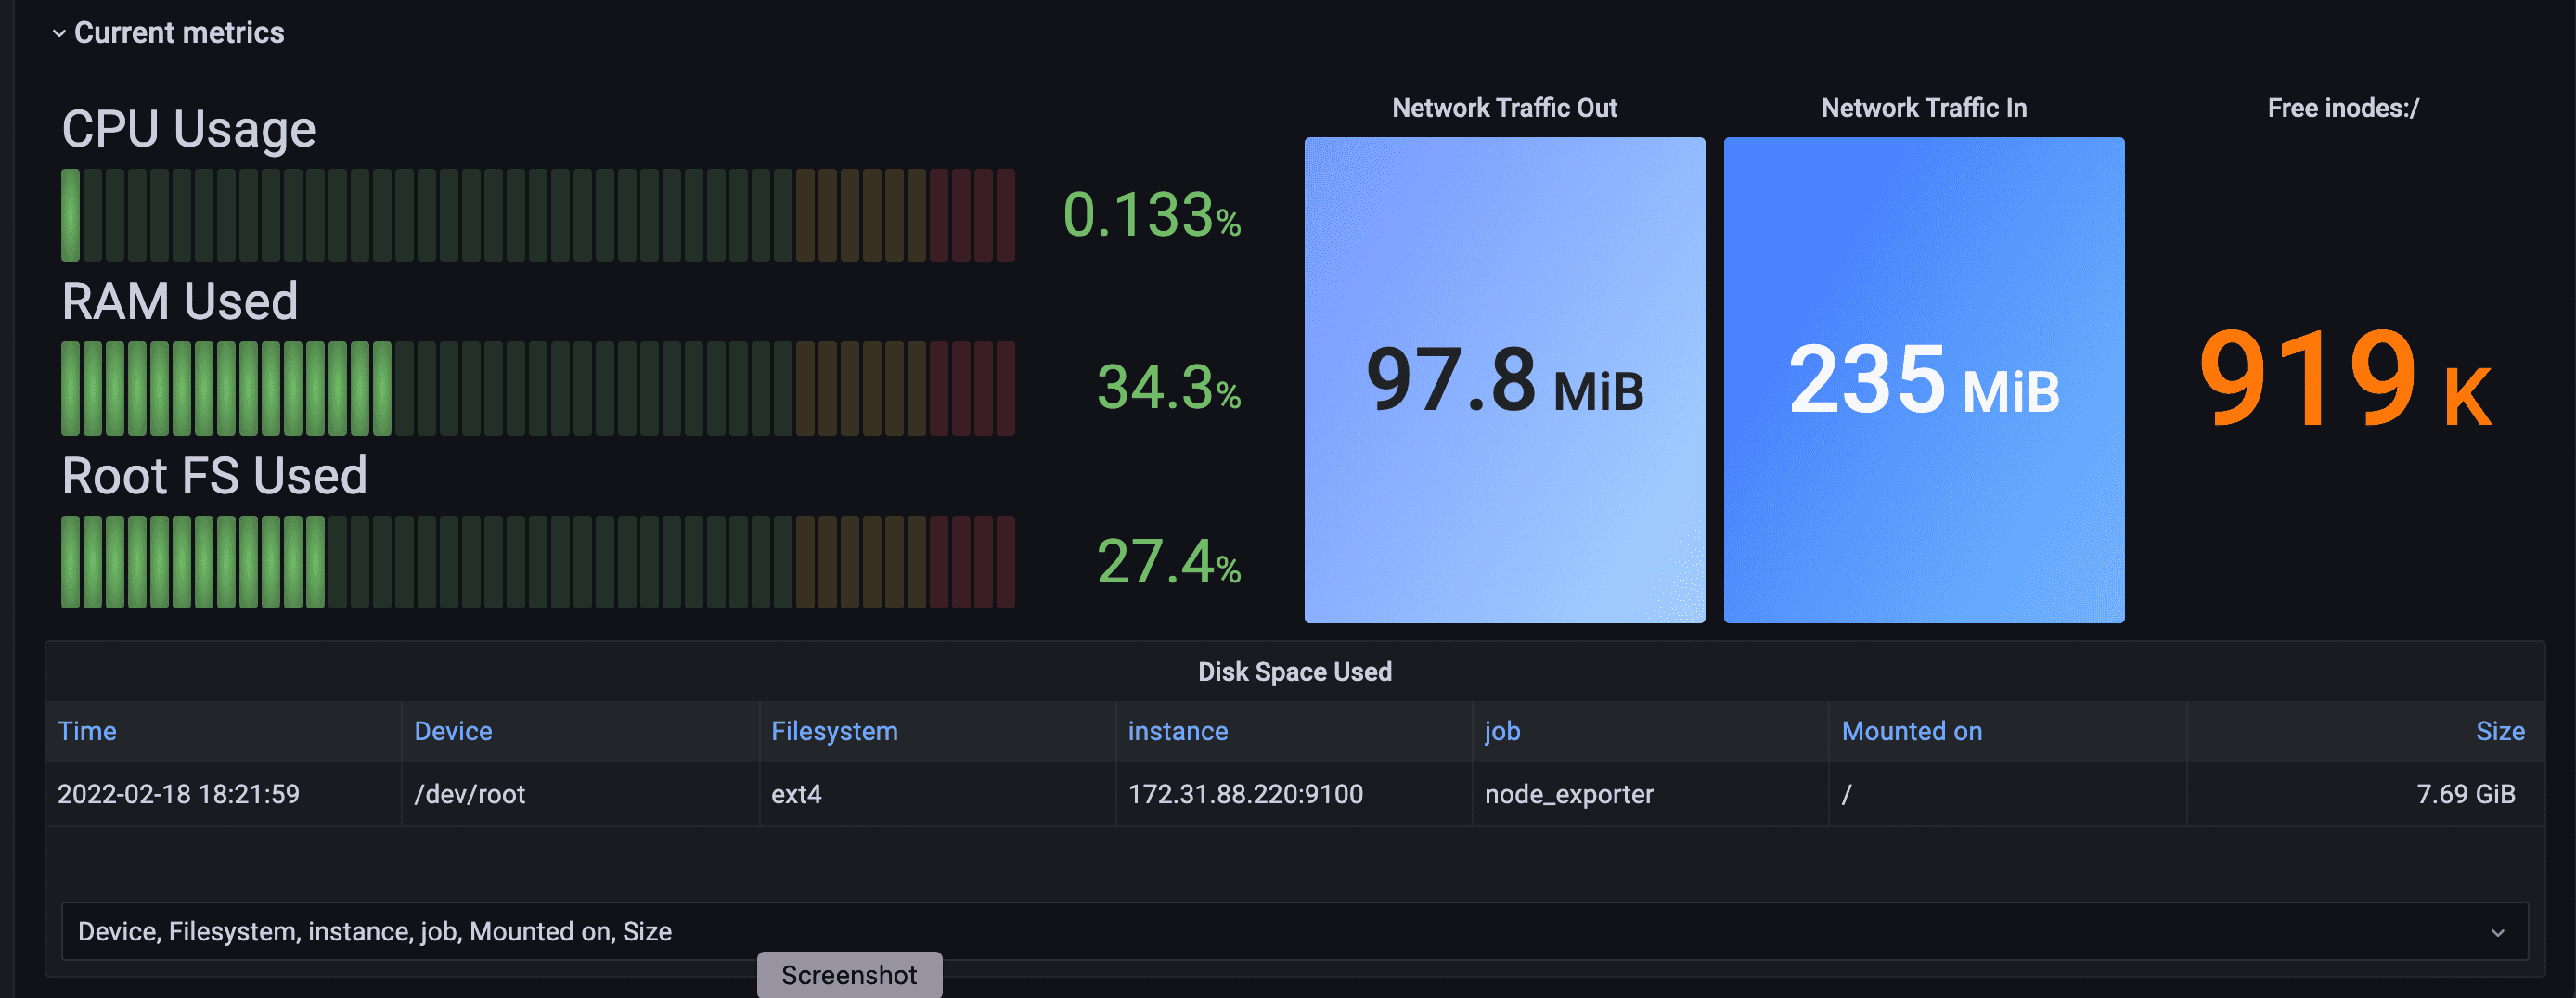
Grafana Dashboard for Host Level Metrics using Node Exporter
Screenshots
Used Metrics 2424
-
node_boot_time_seconds
-
node_cpu_seconds_total
-
node_disk_read_bytes_total
-
node_disk_reads_completed_total
-
node_disk_writes_completed_total
-
node_disk_written_bytes_total
-
node_filesystem_avail_bytes
-
node_filesystem_files_free
-
node_filesystem_free_bytes
-
node_filesystem_size_bytes
-
node_load1
-
node_load15
-
node_load5
-
node_memory_Buffers_bytes
-
node_memory_Cached_bytes
-
node_memory_MemAvailable_bytes
-
node_memory_MemFree_bytes
-
node_memory_MemTotal_bytes
-
node_memory_SwapFree_bytes
-
node_memory_SwapTotal_bytes
-
node_network_receive_bytes_total
-
node_network_transmit_bytes_total
-
node_time_seconds
rate_interval
Get Dashboard✕
Download
Copy to Clipboard