PGbouncer 1,2851,285
Description
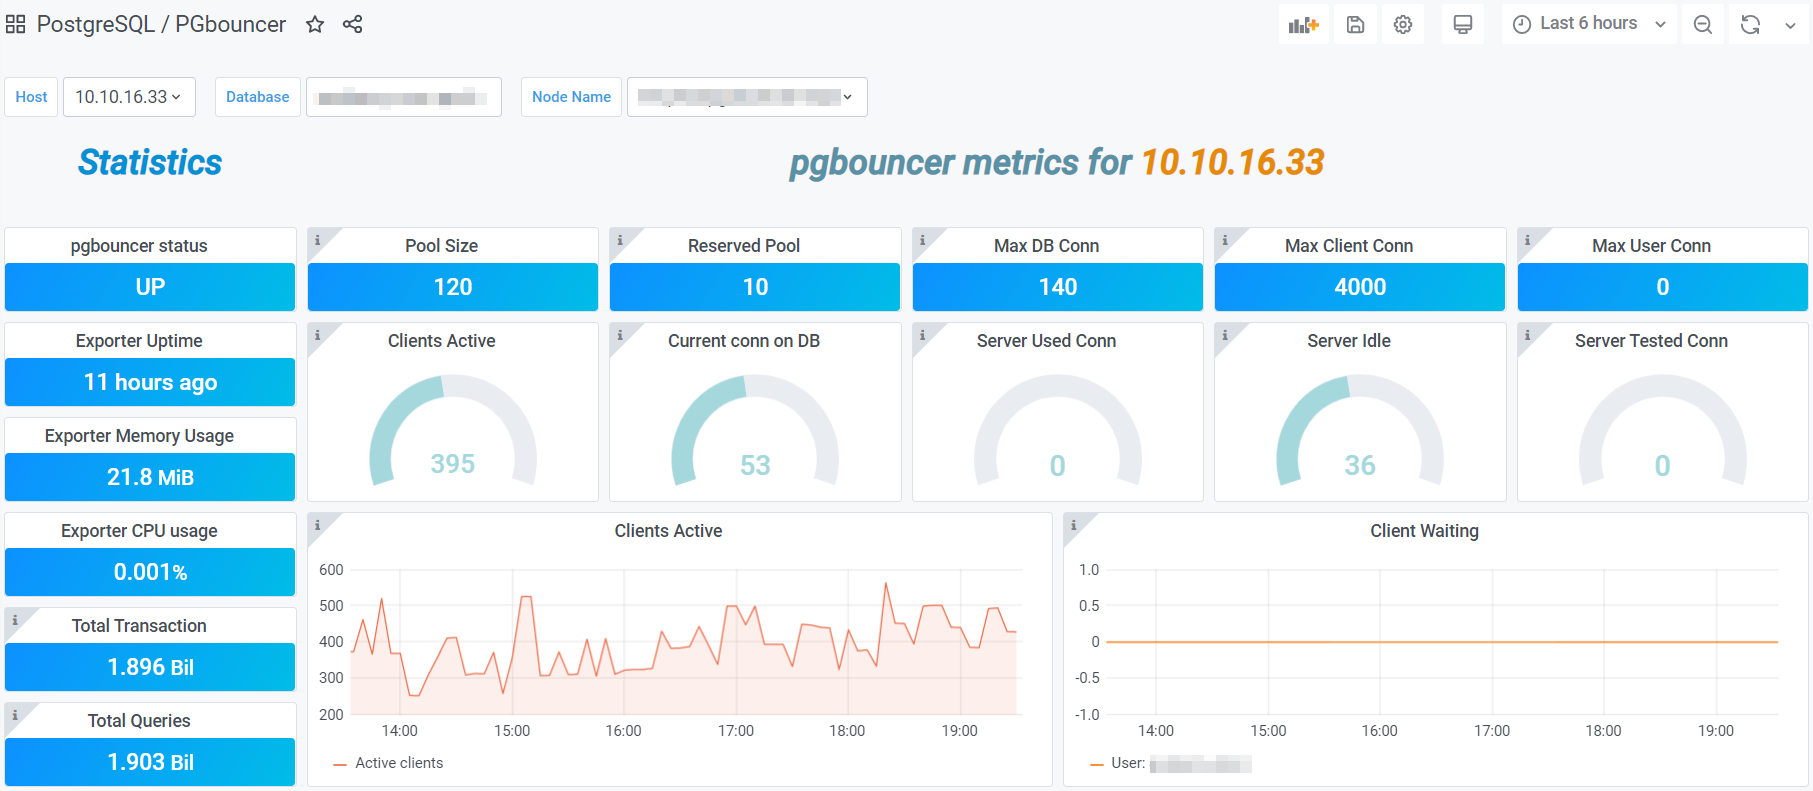
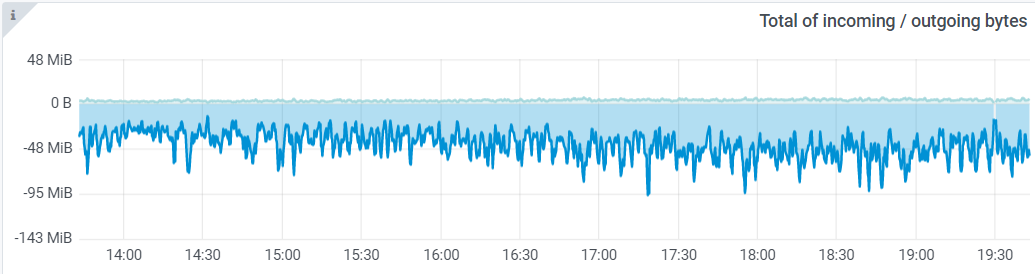
Pgbouncer dashboard for Grafana integrated with Percona PMM as well.
Screenshots
Used Metrics 2525
-
pg_up
pgbouncer_config_max_client_conn
pgbouncer_config_max_user_connections
pgbouncer_databases_database_current_connections
pgbouncer_databases_database_max_connections
pgbouncer_databases_database_pool_size
pgbouncer_databases_database_reserve_pool_size
pgbouncer_pools_client_active_connections
pgbouncer_pools_client_maxwait_seconds
pgbouncer_pools_client_waiting_connections
pgbouncer_pools_server_idle_connections
pgbouncer_pools_server_login_connections
pgbouncer_pools_server_testing_connections
pgbouncer_pools_server_used_connections
pgbouncer_stats_queries_duration_microseconds_total
pgbouncer_stats_queries_total
pgbouncer_stats_received_bytes_total
pgbouncer_stats_sent_bytes_total
pgbouncer_stats_transactions_duration_microseconds_total
pgbouncer_stats_transactions_total
pgbouncer_stats_waiting_duration_microseconds_total
pgbouncer_up
-
process_cpu_seconds_total
-
process_resident_memory_bytes
-
process_start_time_seconds