Pod Overview 9,9509,950 3.0 (1 reviews)
1/29/2020
1/29/2020
4
>=6.4.2
Prometheus
Description
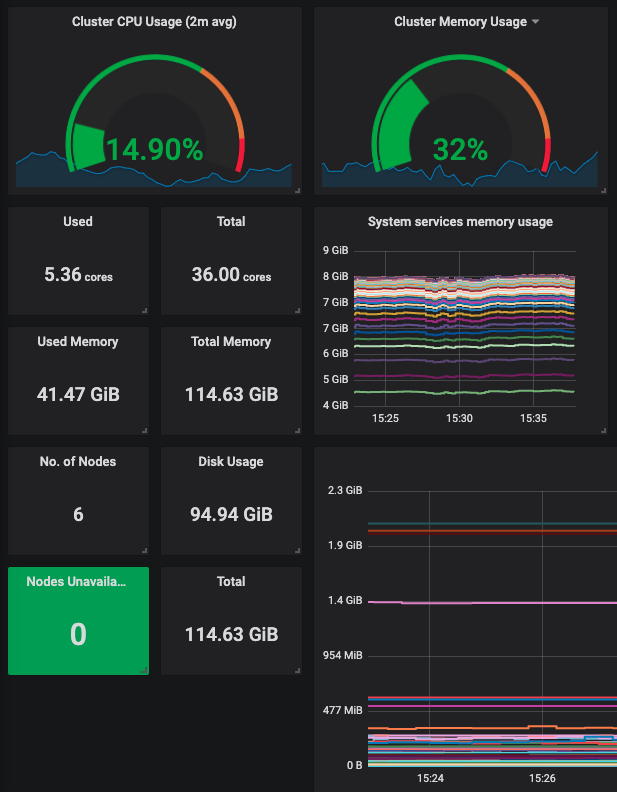
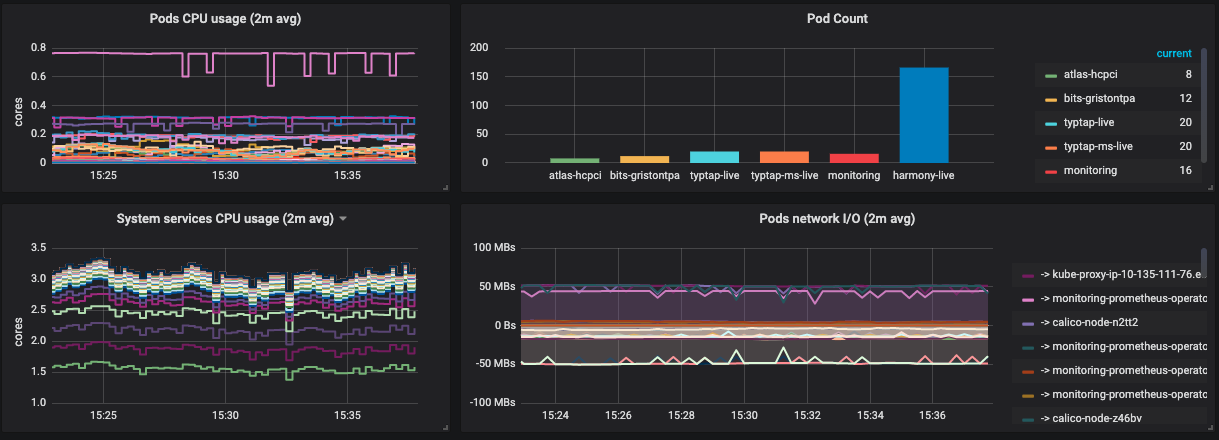
Monitors Kubernetes cluster using Prometheus. Shows overall cluster CPU / Memory / Filesystem usage as well as individual pod, containers, control plane (as deployed by kops) statistics. Uses cAdvisor metrics only. Tweaked from https://grafana.com/dashboards/3119 to add total pod and container count and the total nodes resource usage.
Screenshots
Used Metrics 1616
-
container_cpu_usage_seconds_total
-
container_memory_working_set_bytes
-
container_network_receive_bytes_total
-
container_network_transmit_bytes_total
interval
kube_node_spec_unschedulable
kube_pod_info
-
machine_cpu_cores
-
machine_memory_bytes
-
node_filesystem_avail_bytes
-
node_filesystem_size_bytes
-
node_memory_Buffers_bytes
-
node_memory_Cached_bytes
-
node_memory_MemFree_bytes
-
node_memory_MemTotal_bytes
-
node_uname_info
Get Dashboard✕
Download
Copy to Clipboard