Pod Stats & Info 127,684127,684 3.0 (2 reviews)
Description
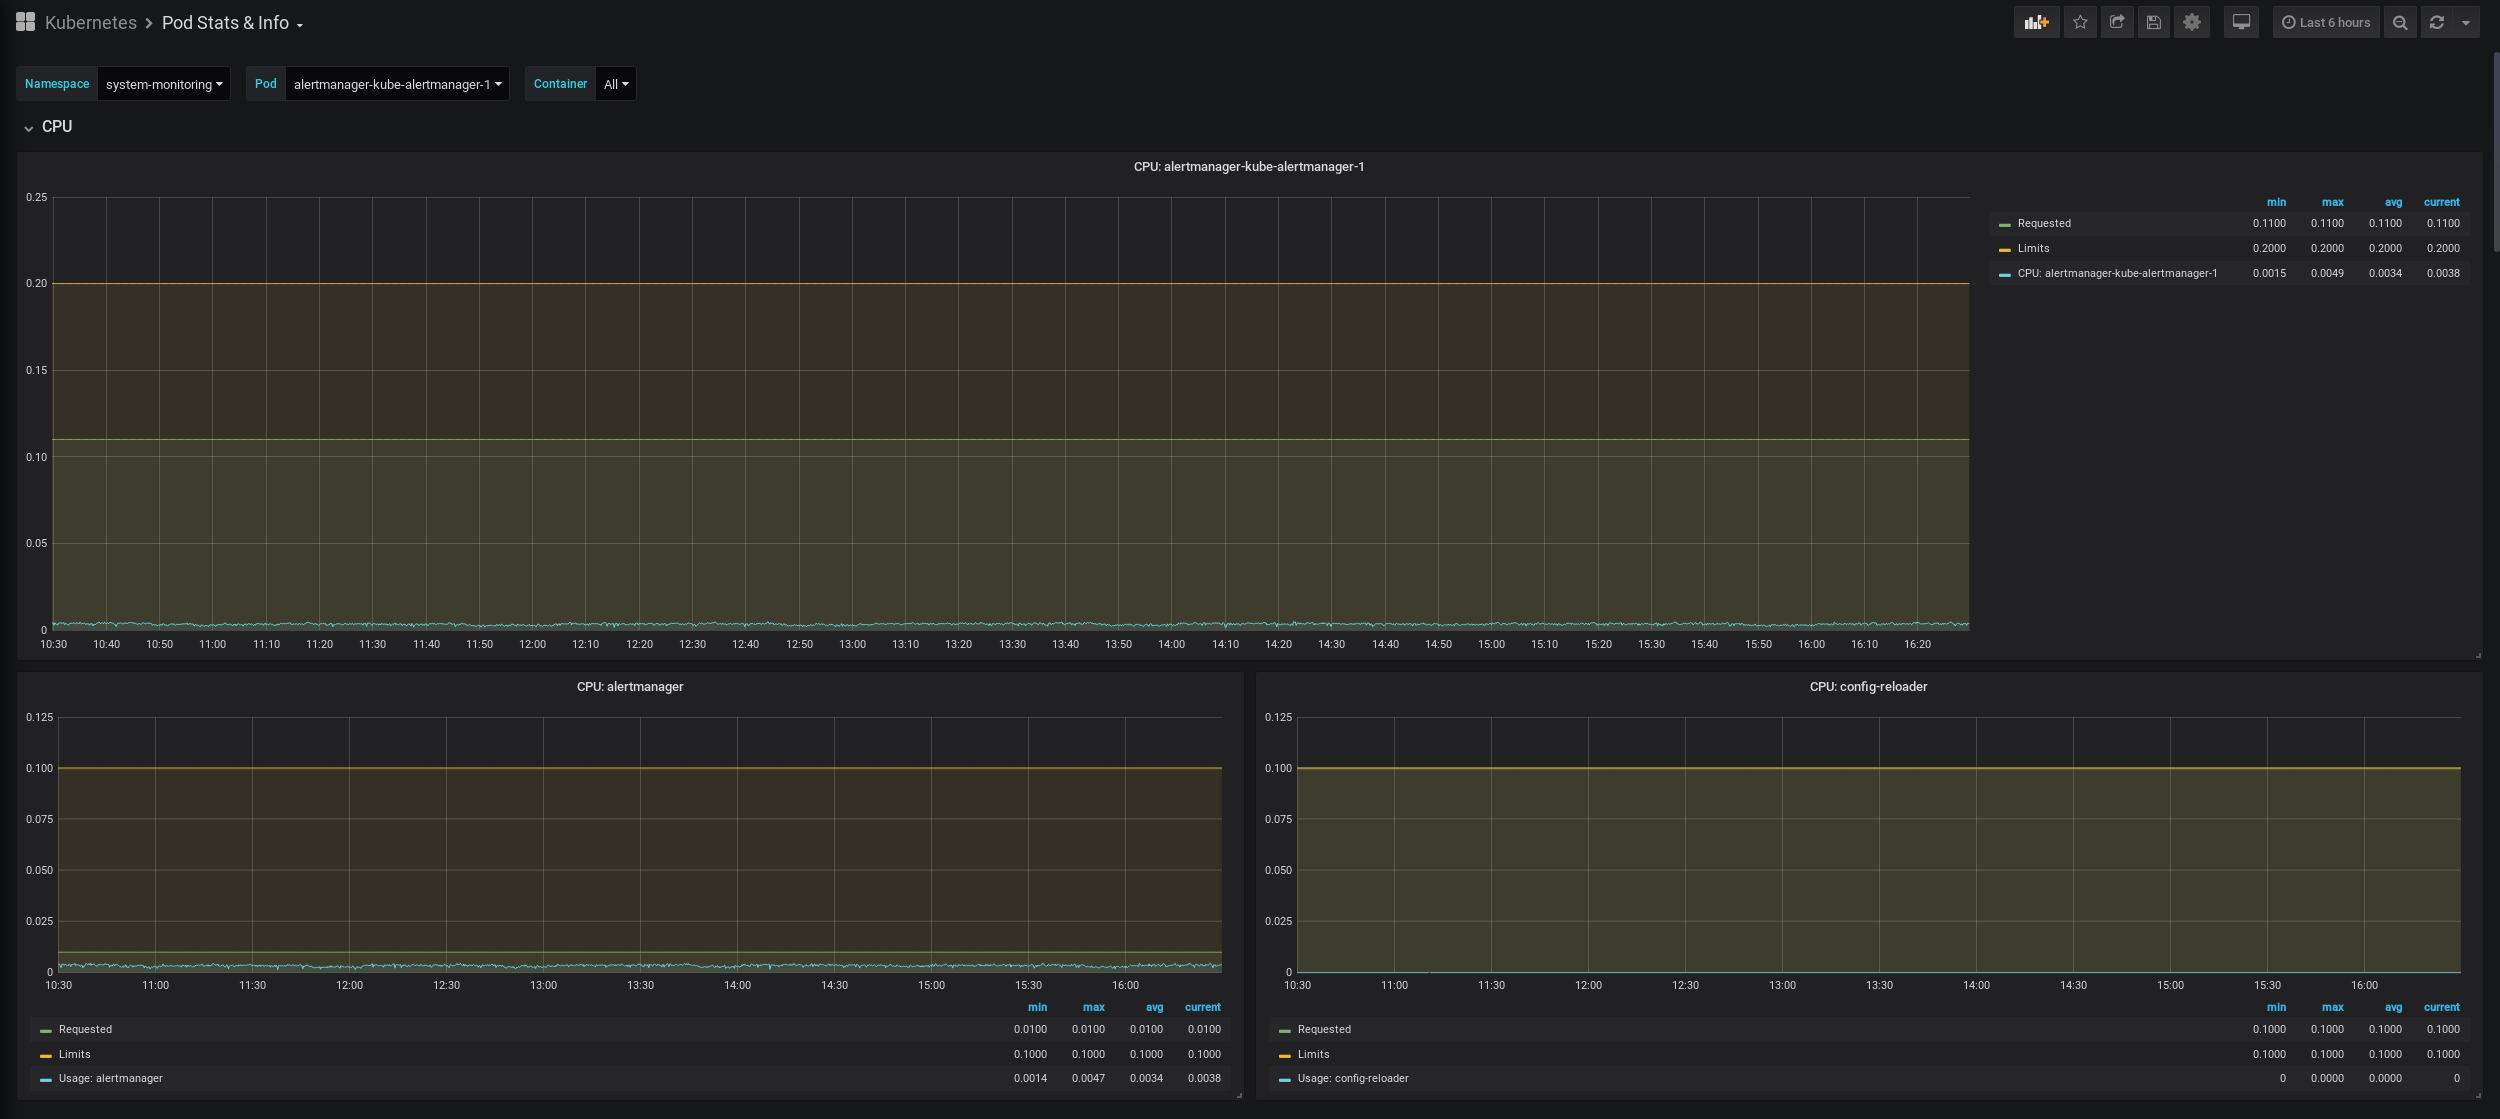
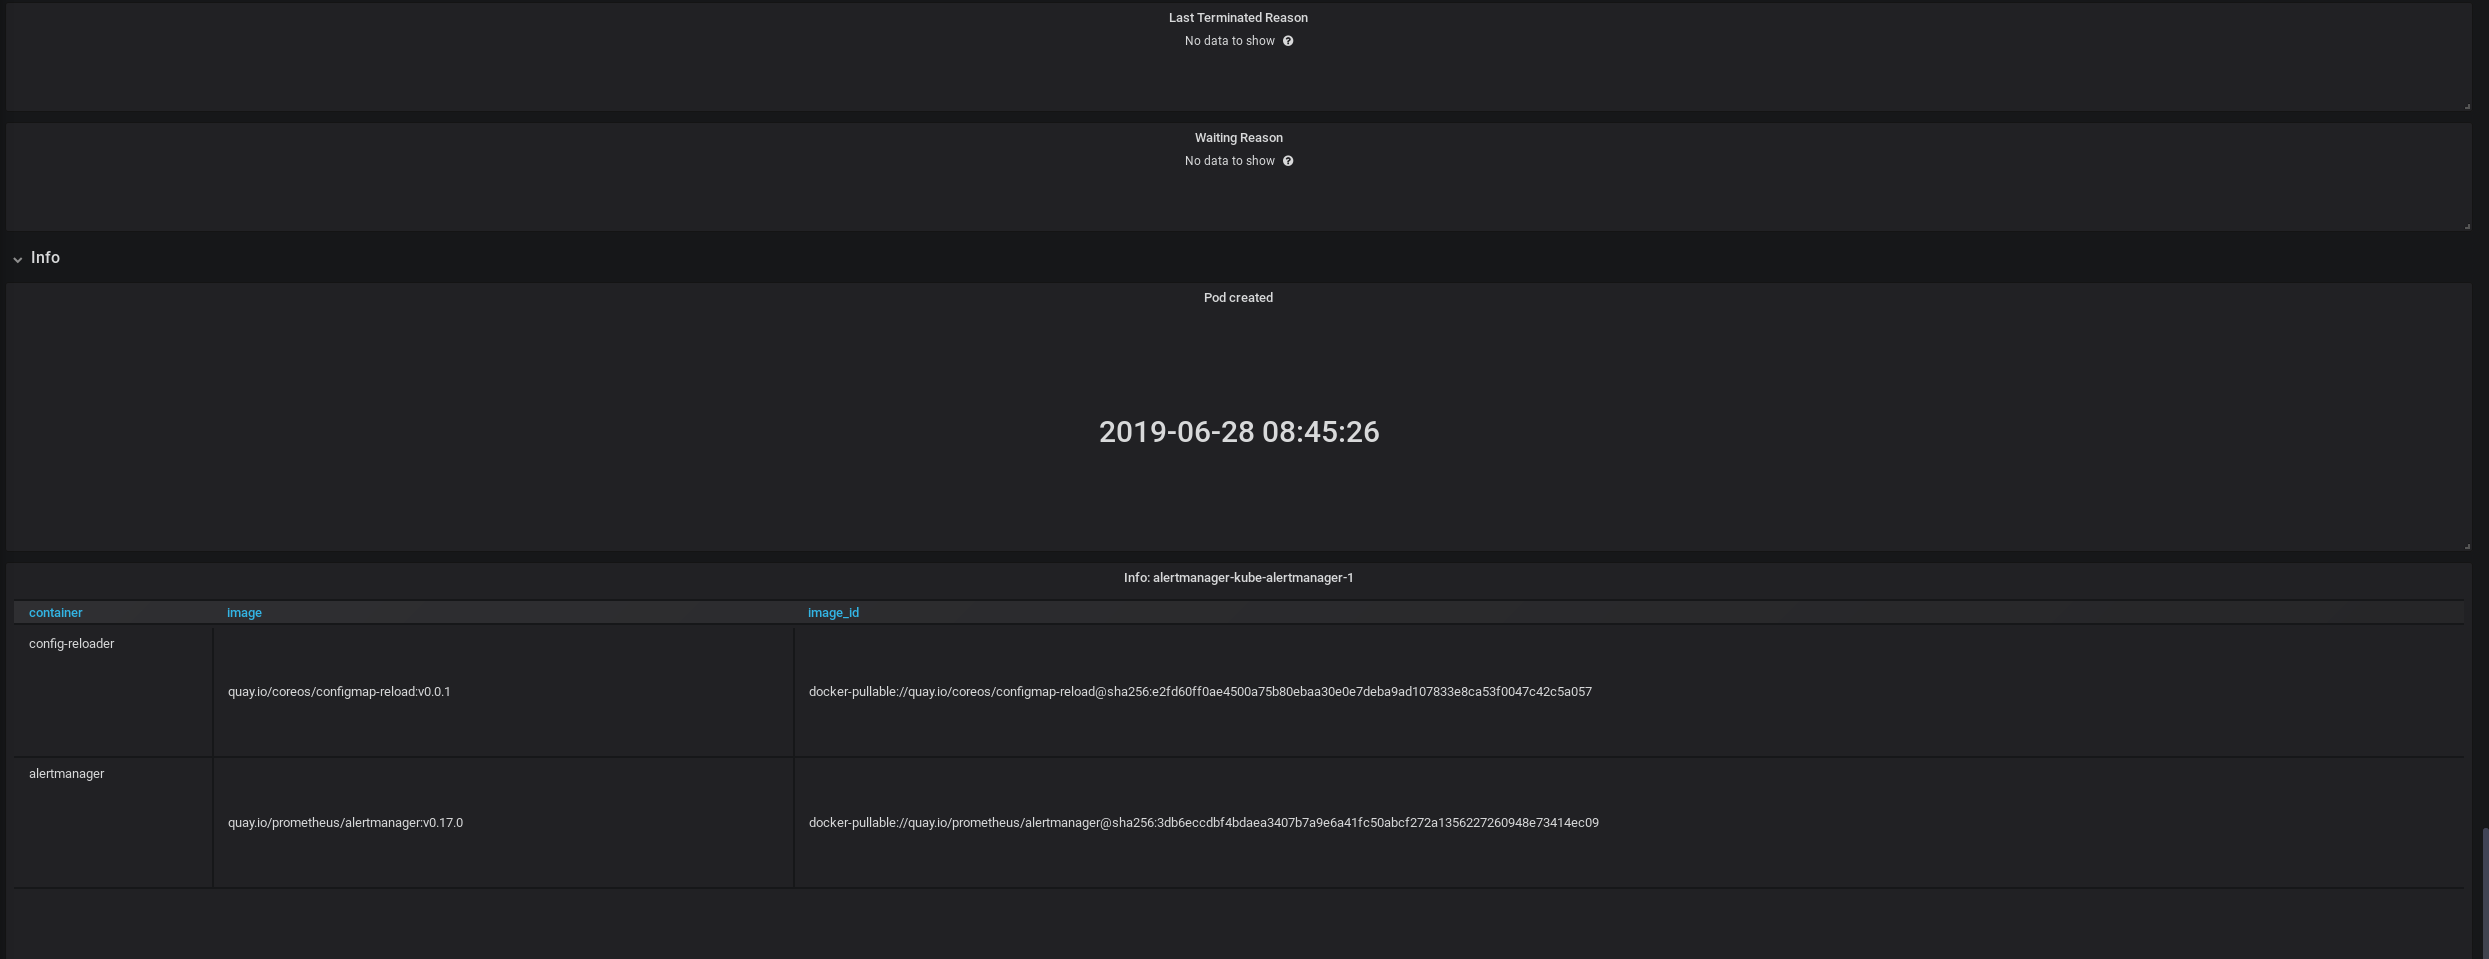
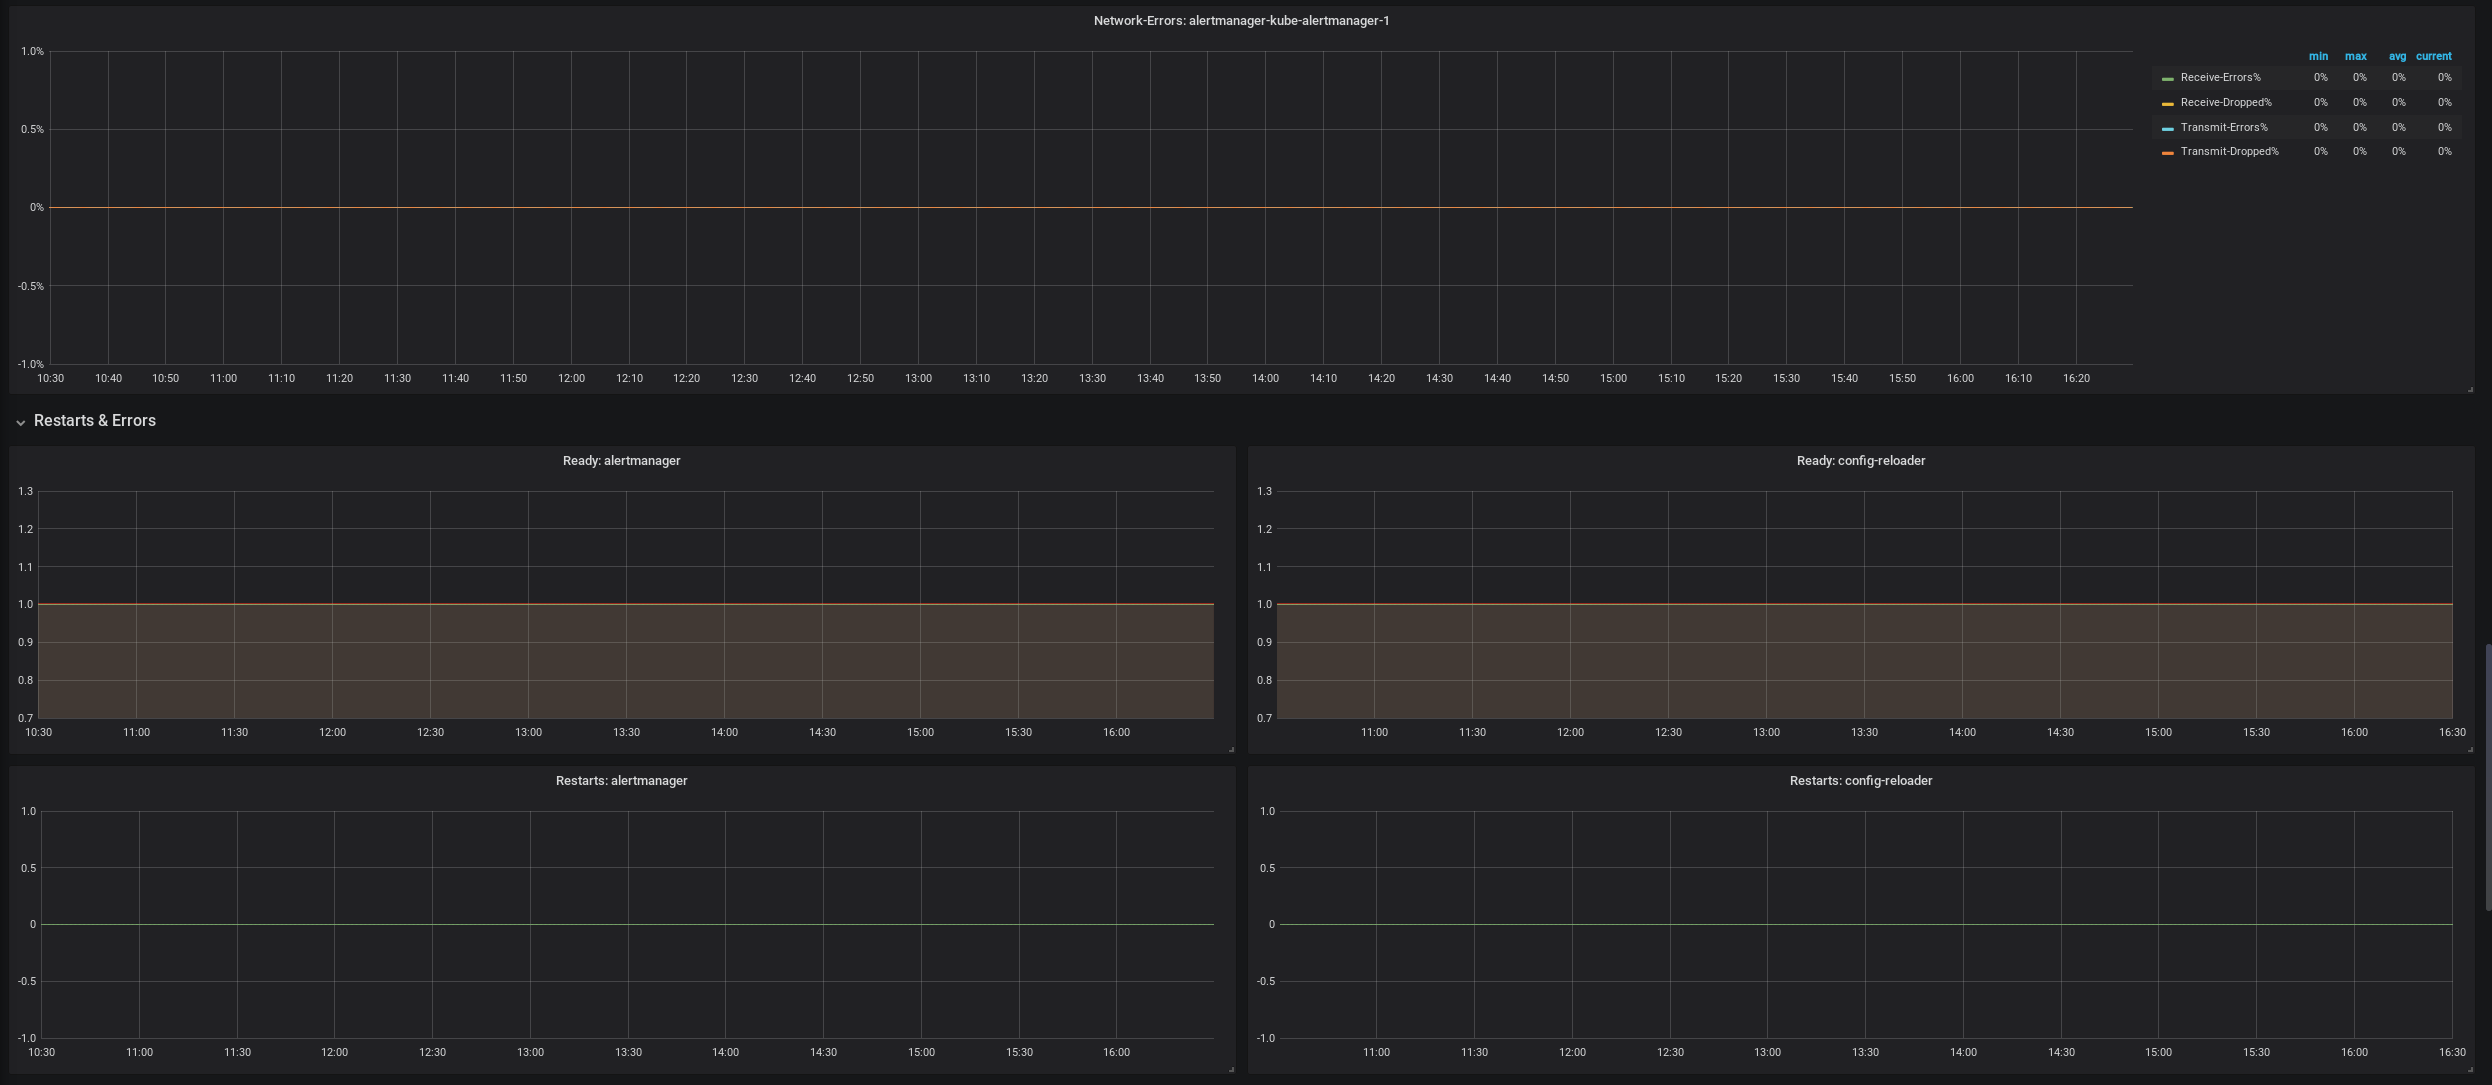
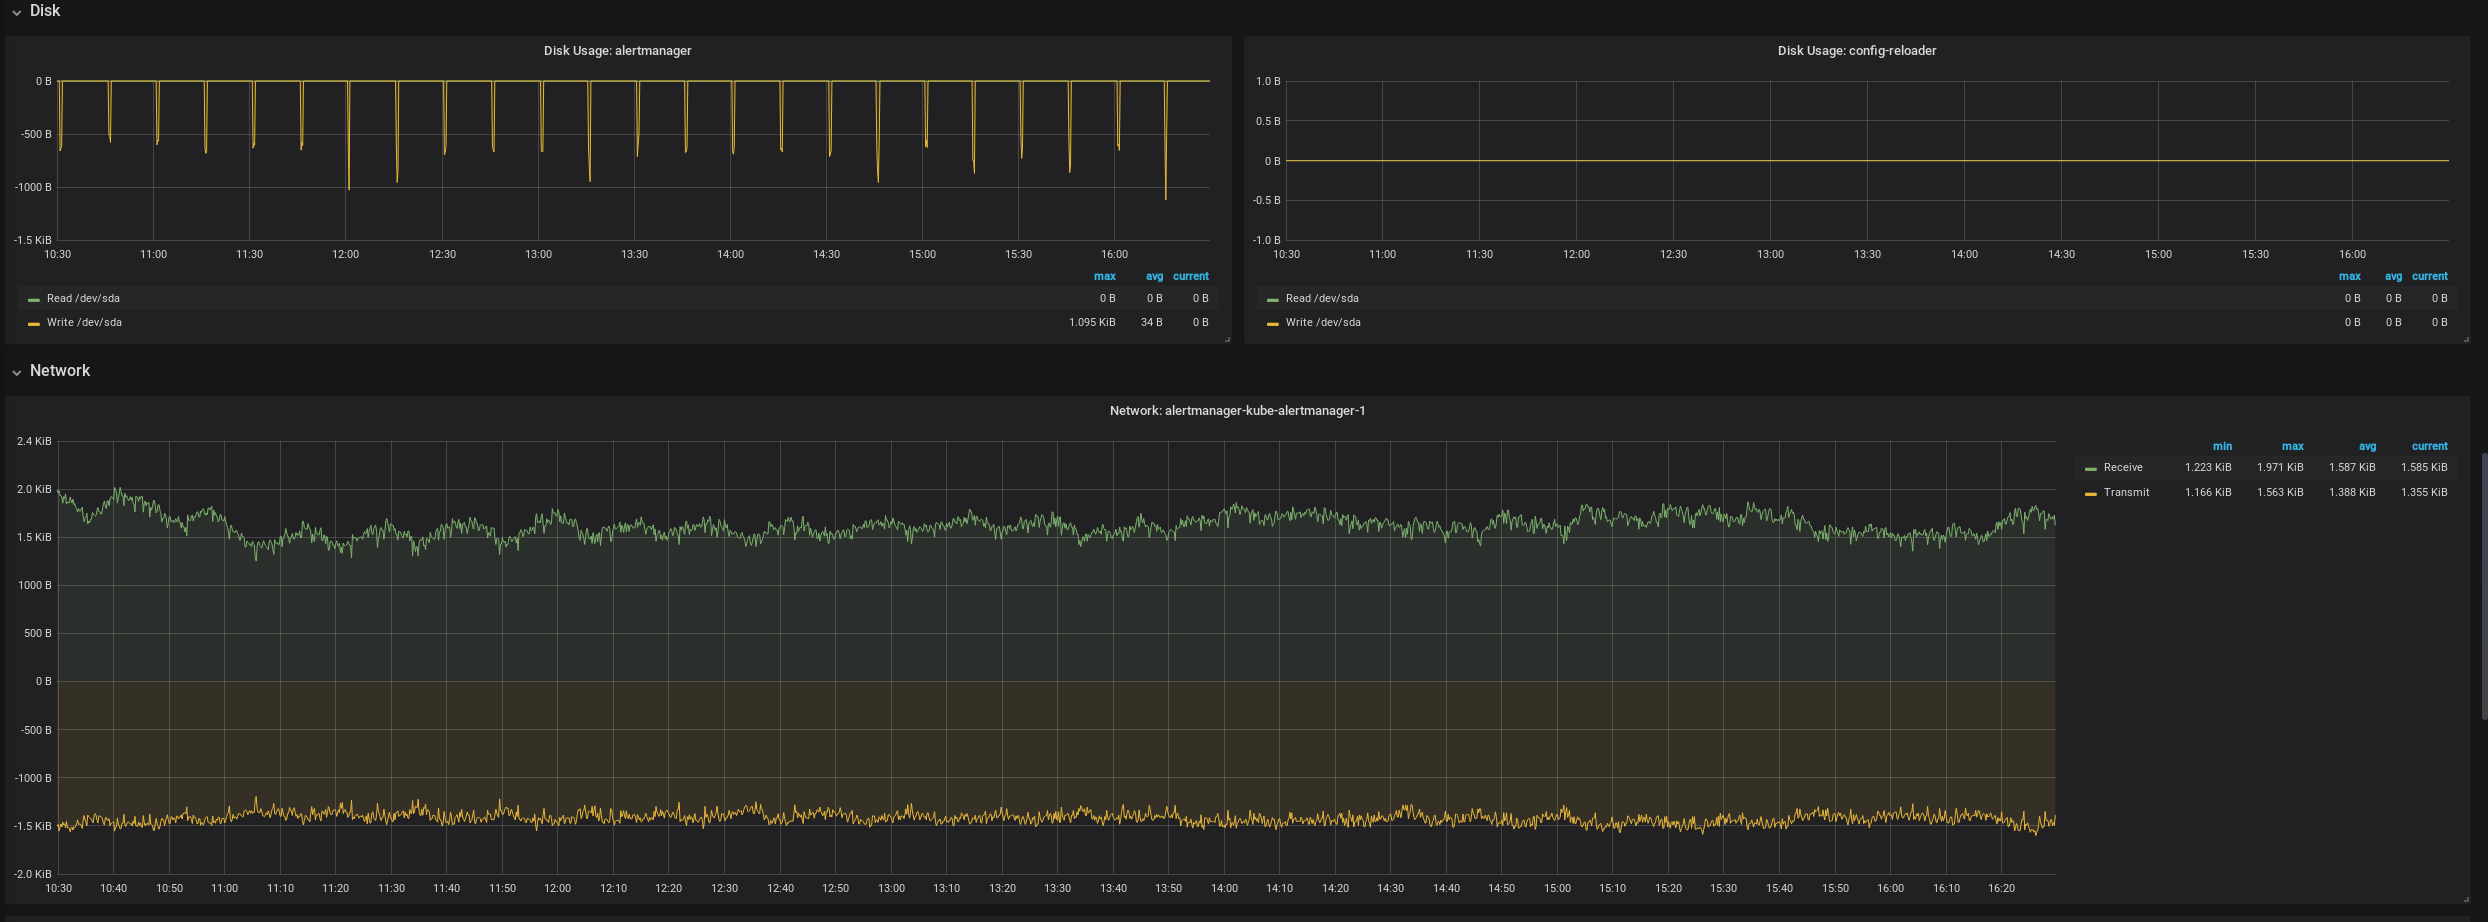
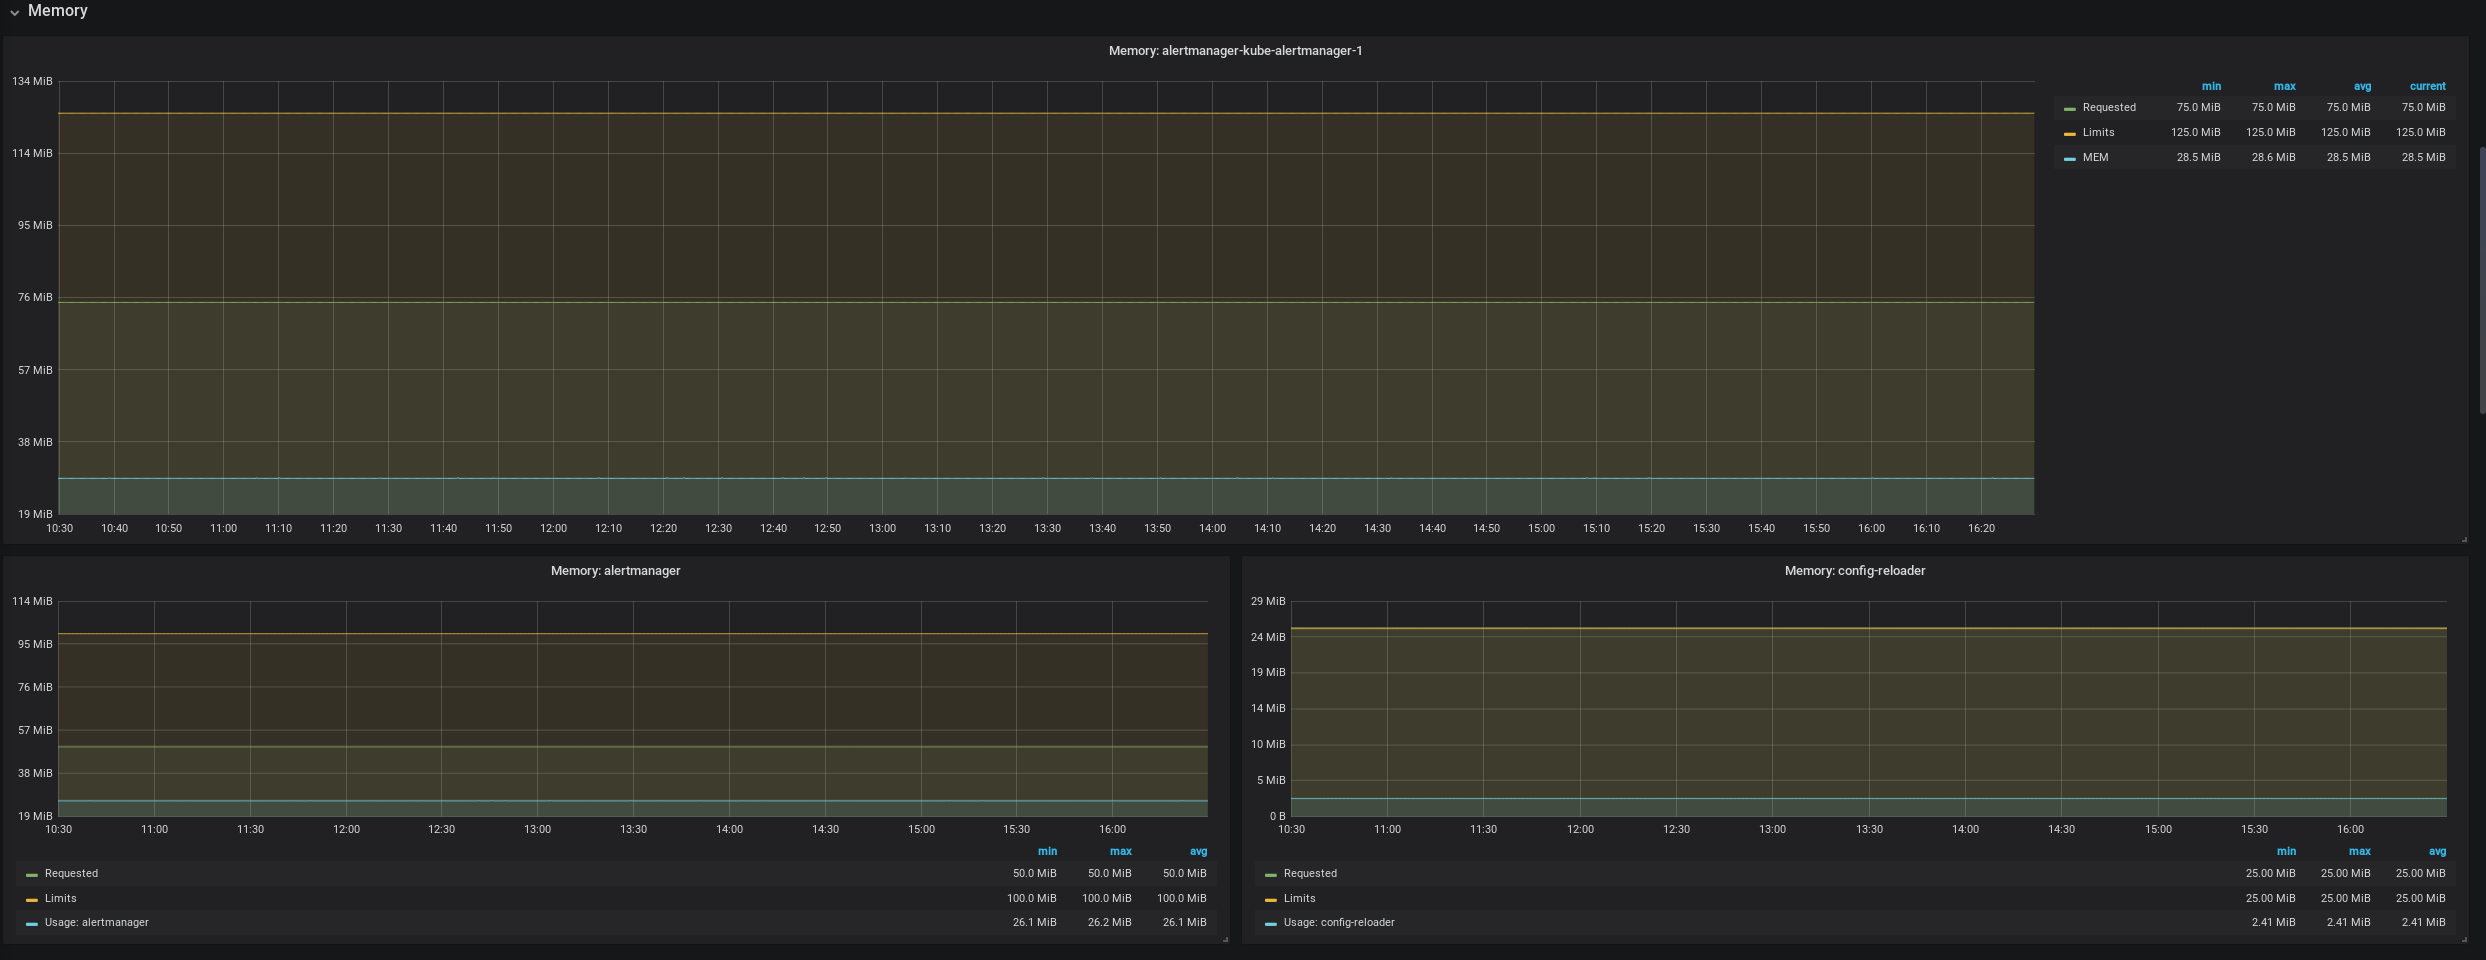
Monitors Kubernetes Pod health and resource usage by aggregating per-pod and per-container metrics. It highlights CPU and memory demand with panels like container_cpu_usage_seconds_total, container_memory_working_set_bytes, and tracks I/O and networking activity through panels such as container_fs_reads_bytes_total/container_fs_writes_bytes_total and container_network_receive_bytes_total/container_network_transmit_bytes_total. Key features include readiness, restarts, and termination reasons per container, as well as pod-level metadata (e.g., Pod created, Info: $pod) to surface lifecycle events and current state at a glance.
Screenshots
Used Metrics 1919
-
container_cpu_usage_seconds_total
-
container_fs_reads_bytes_total
-
container_fs_writes_bytes_total
-
container_memory_working_set_bytes
-
container_network_receive_bytes_total
-
container_network_receive_errors_total
-
container_network_receive_packets_dropped_total
-
container_network_receive_packets_total
-
container_network_transmit_bytes_total
-
container_network_transmit_errors_total
-
container_network_transmit_packets_total
kube_pod_container_info
kube_pod_container_resource_limits
kube_pod_container_resource_requests
kube_pod_container_status_last_terminated_reason
kube_pod_container_status_ready
kube_pod_container_status_restarts_total
kube_pod_container_status_waiting_reason
kube_pod_created