PolicyReport Details 24,812,19424,812,194
3/3/2021
10/23/2023
5
>=10.1.5
Prometheus
Description
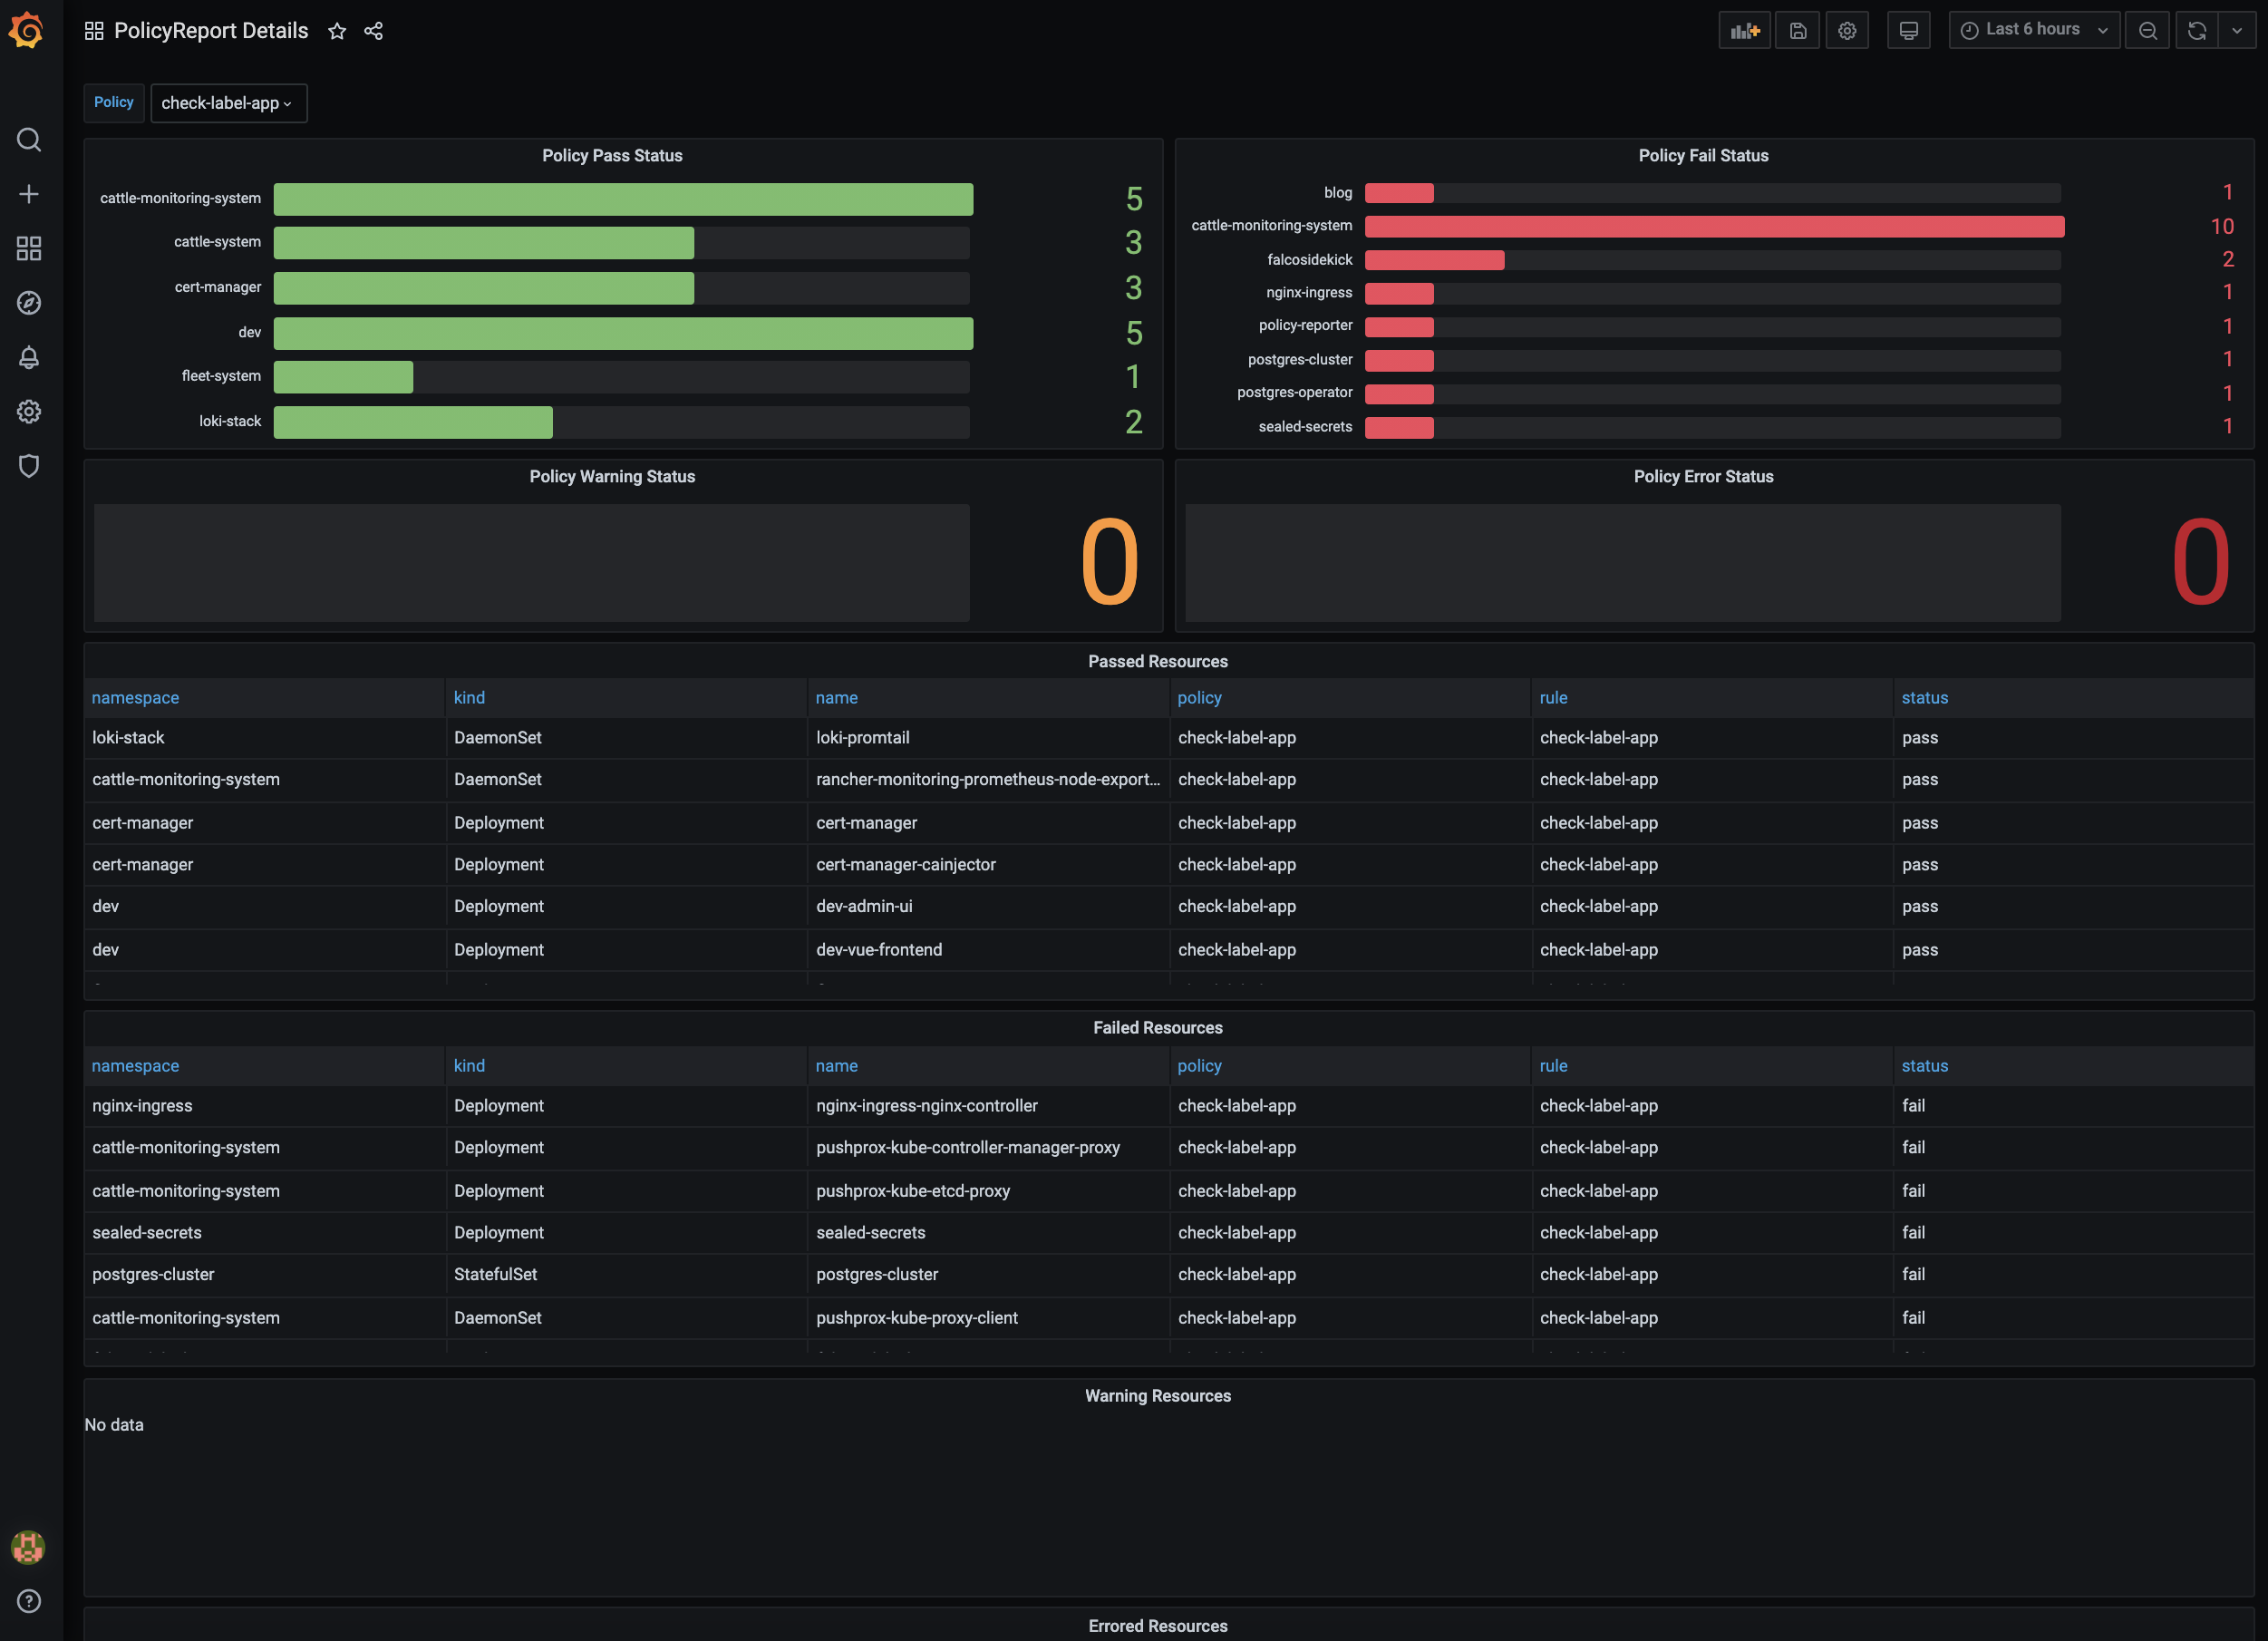
This dashboard monitors policy evaluation outcomes across resources by aggregating policy_report_result into separate panels for Pass, Fail, Warning, and Error statuses, plus a timeline view to track status changes over time. It highlights resource-level counts (e.g., Passed Resources, Failed Resources) and uses distinct status panels to quickly diagnose where policies are succeeding or failing, supported by a time-series Status Timeline to observe trends.
Screenshots
Used Metrics 11
policy_report_result
Get Dashboard✕
Download
Copy to Clipboard