PostgreSQL Exporter Quickstart and Dashboard 8,627,7178,627,717 5.0 (1 reviews)
Description
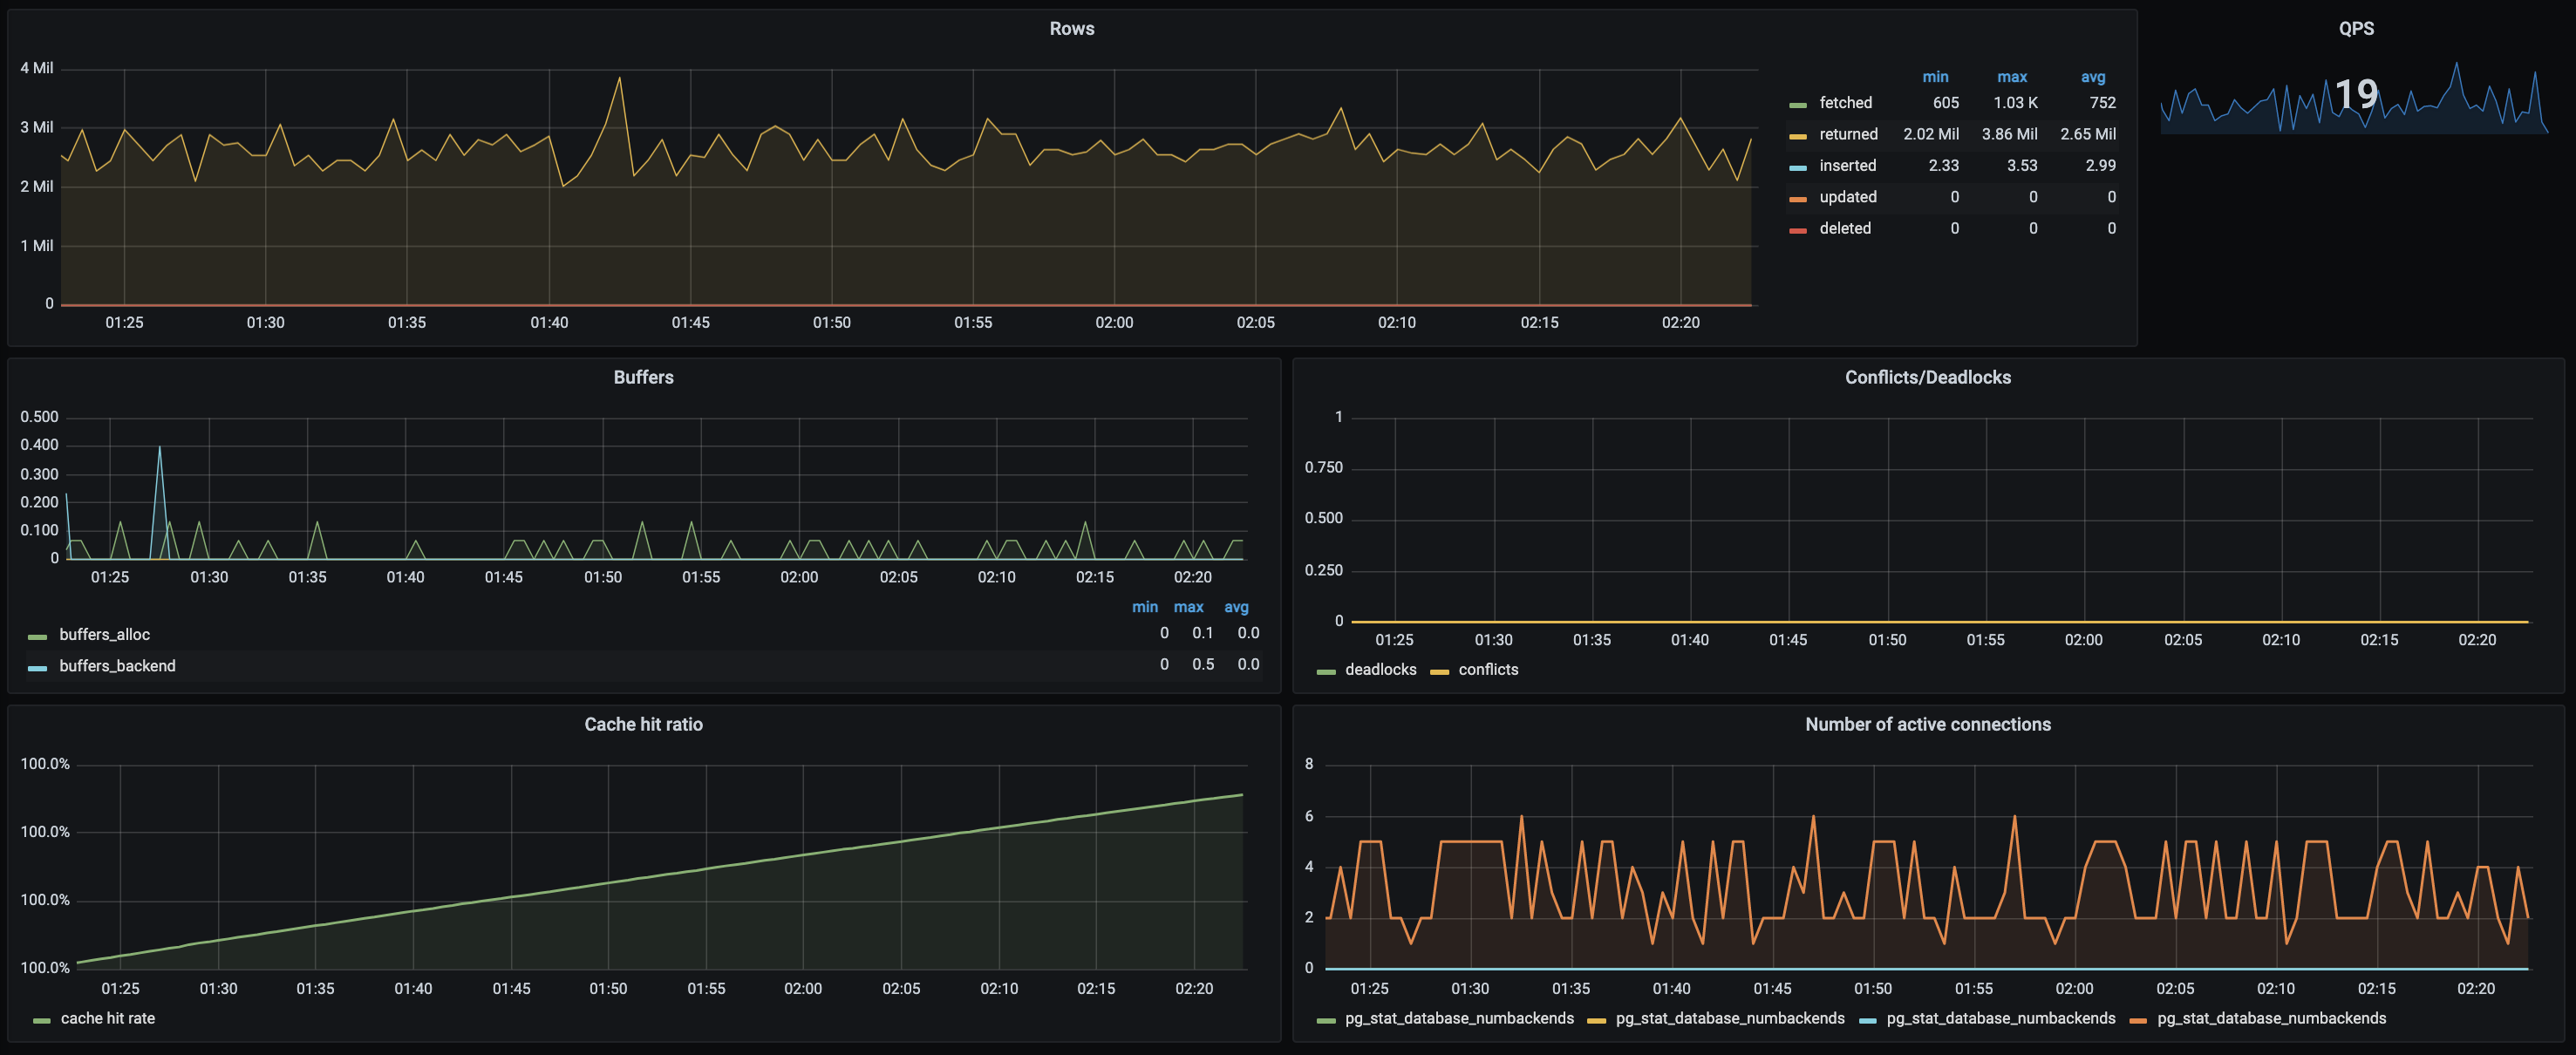
This dashboard monitors PostgreSQL performance and health by visualizing core DB metrics derived from the exporter. It highlights transactional throughput and I/O activity, with key panels such as QPS (queries per second) and Conflicts/Deadlocks to surface contention, as well as Cache hit ratio to assess cache efficiency. Other notable metrics include activity counters like pg_stat_database_tup_fetched/inserted/updated/deleted and background writer activity via pg_stat_bgwriter_buffers_alloc, providing insight into write amplification and I/O bottlenecks.
Screenshots
Used Metrics 1717
-
pg_stat_bgwriter_buffers_alloc
-
pg_stat_bgwriter_buffers_backend
-
pg_stat_bgwriter_buffers_backend_fsync
-
pg_stat_bgwriter_buffers_checkpoint
-
pg_stat_bgwriter_buffers_clean
-
pg_stat_database_blks_hit
-
pg_stat_database_blks_read
-
pg_stat_database_conflicts
-
pg_stat_database_deadlocks
-
pg_stat_database_numbackends
-
pg_stat_database_tup_deleted
-
pg_stat_database_tup_fetched
-
pg_stat_database_tup_inserted
-
pg_stat_database_tup_returned
-
pg_stat_database_tup_updated
-
pg_stat_database_xact_commit
-
pg_stat_database_xact_rollback