Prometheus Blackbox Exporter 13,890,70213,890,702 4.0 (8 reviews)
8/19/2018
8/19/2018
3
Host MetricsWeb Servers
>=5.2.2
Prometheus
Description
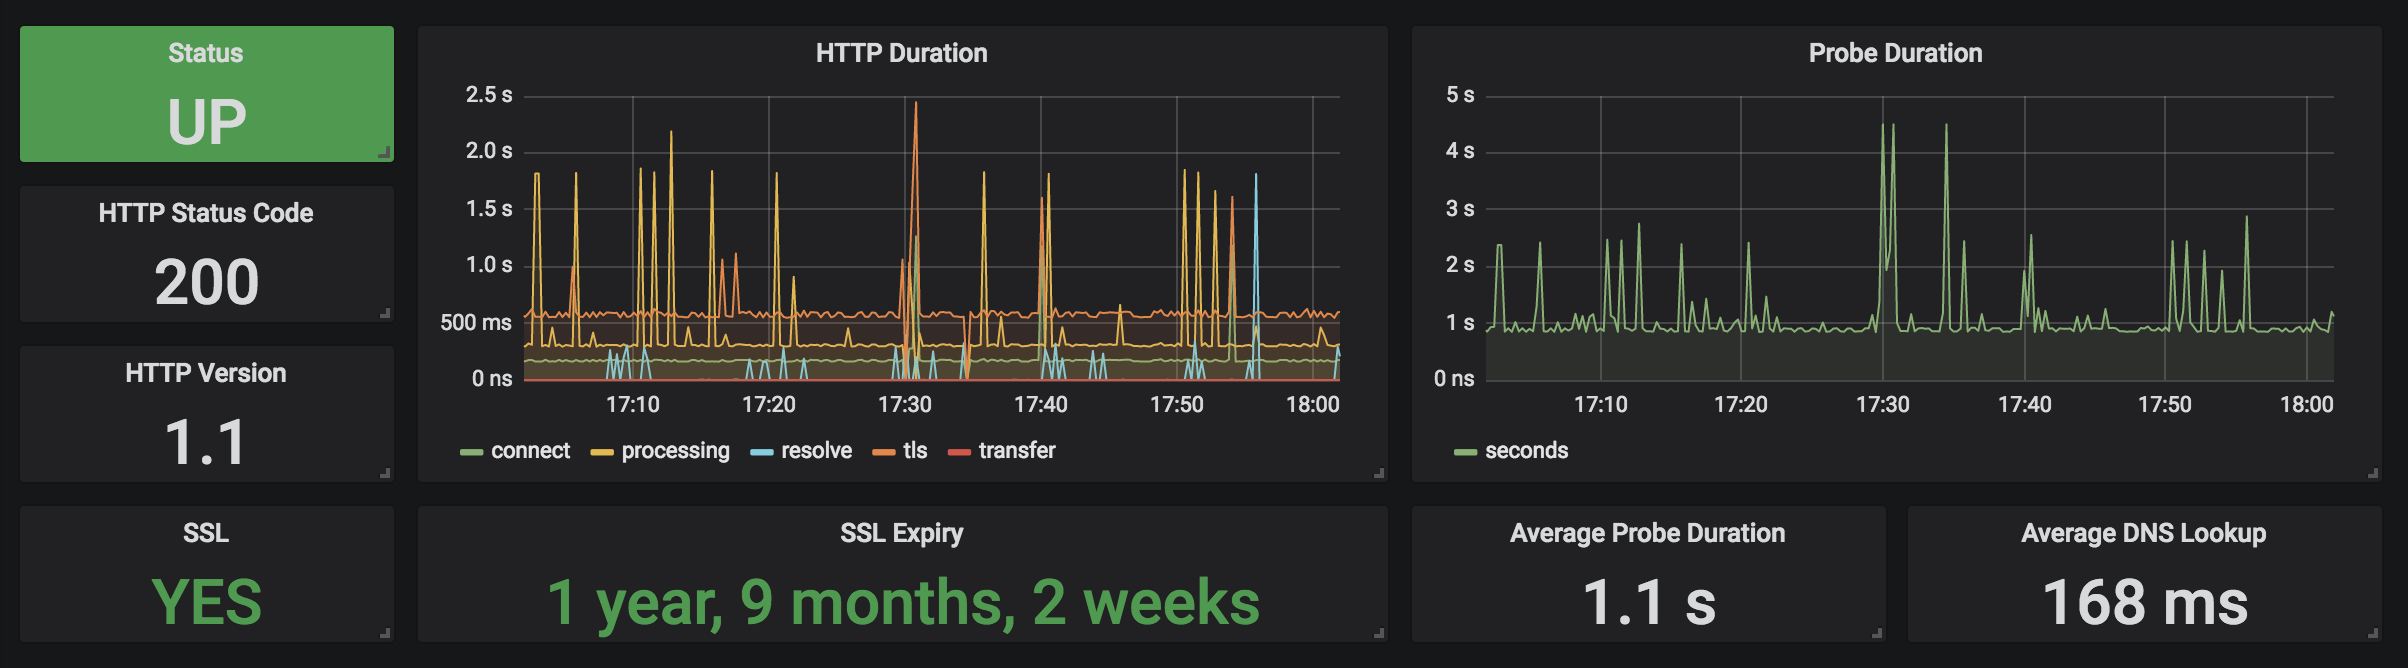
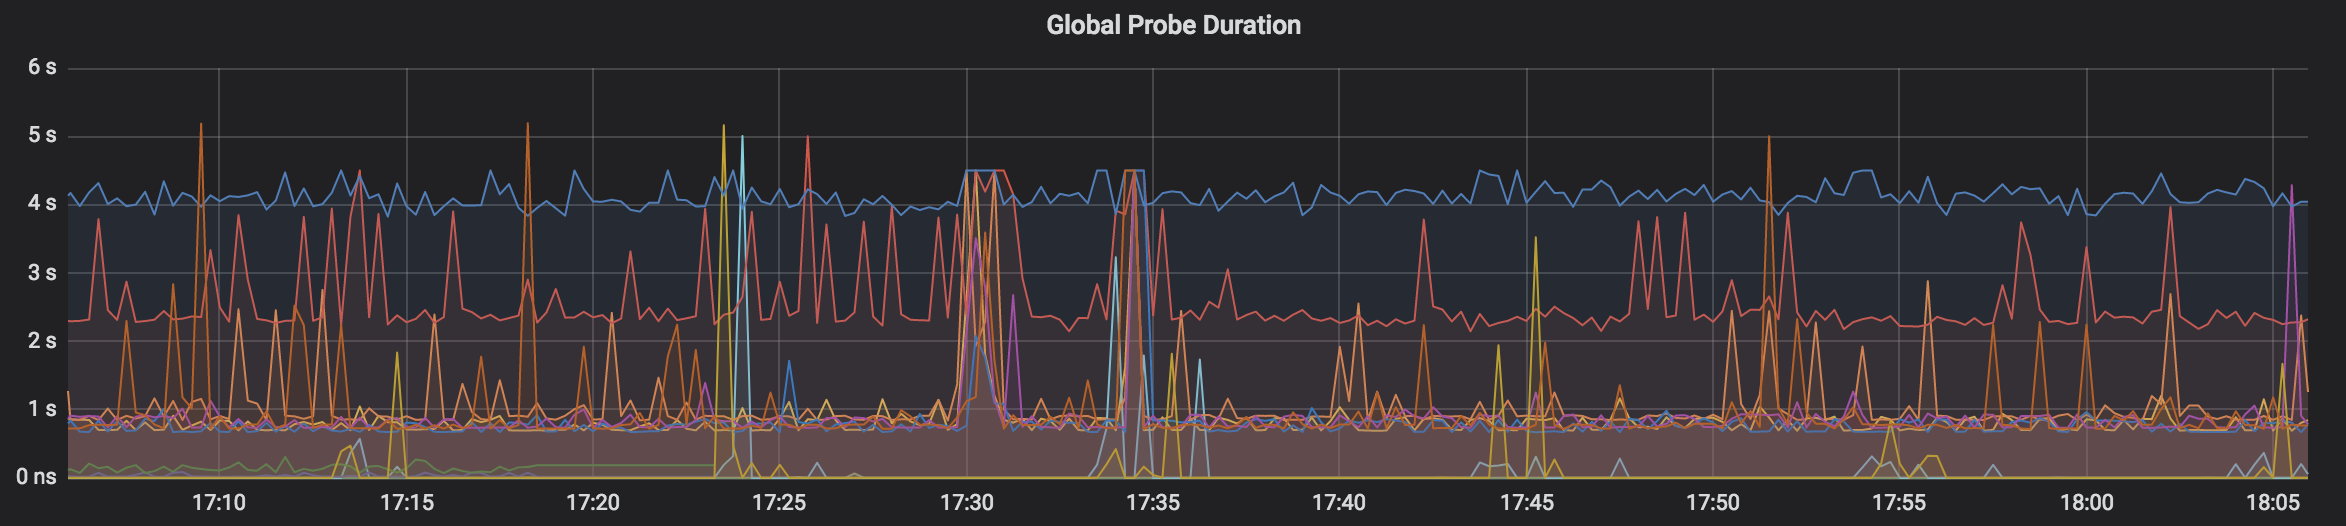
This dashboard monitors the health and performance of HTTP endpoints using the Blackbox Exporter, tracking end-to-end probe results and response characteristics. It highlights key metrics like probe_duration_seconds, probe_http_duration_seconds, and probe_http_status_code to surface latency, success rate, and HTTP responses, while also providing visibility into SSL validity with probe_ssl_earliest_cert_expiry and DNS timing via probe_dns_lookup_time_seconds. Overall views include probe success, average durations, and SSL expiry insights to quickly assess end-user impact and certificate health.
Screenshots
Get Dashboard✕
Download
Copy to Clipboard