RabbitMQ-Quorum-Queues-Raft 32,872,87332,872,873
12/3/2019
10/28/2025
9
RabbitMQ
>=12.2.0
Prometheus
Description
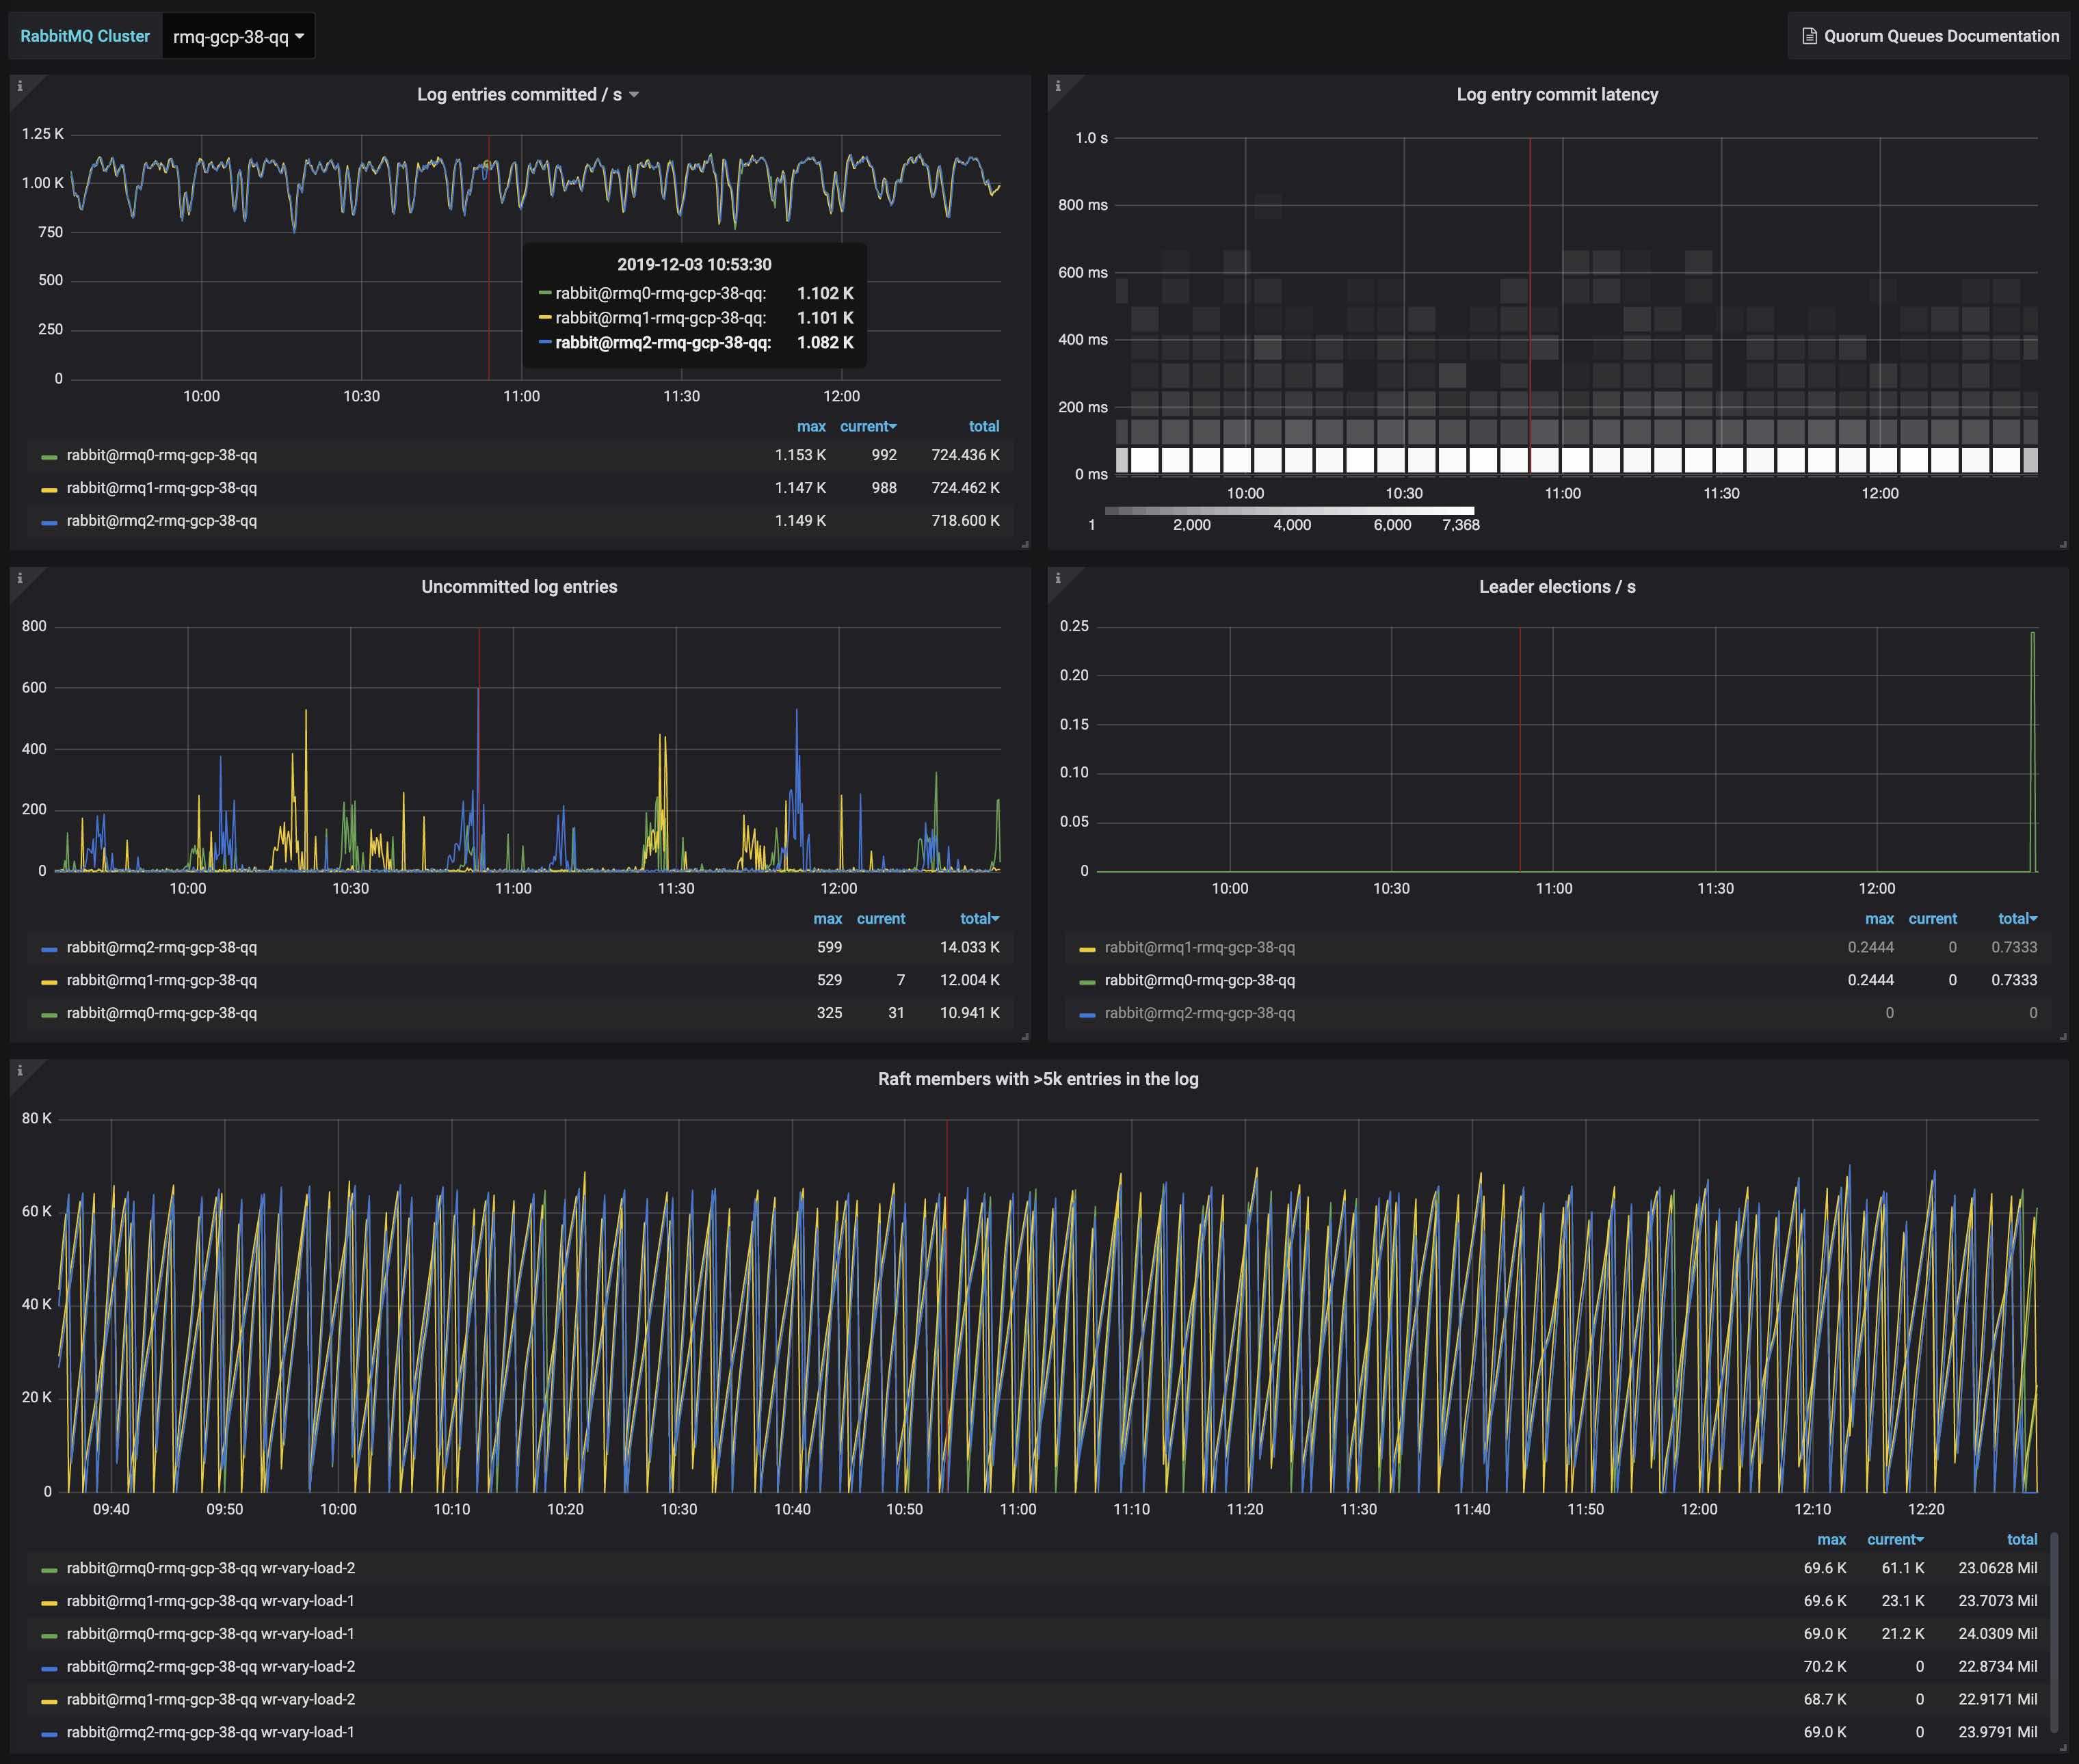
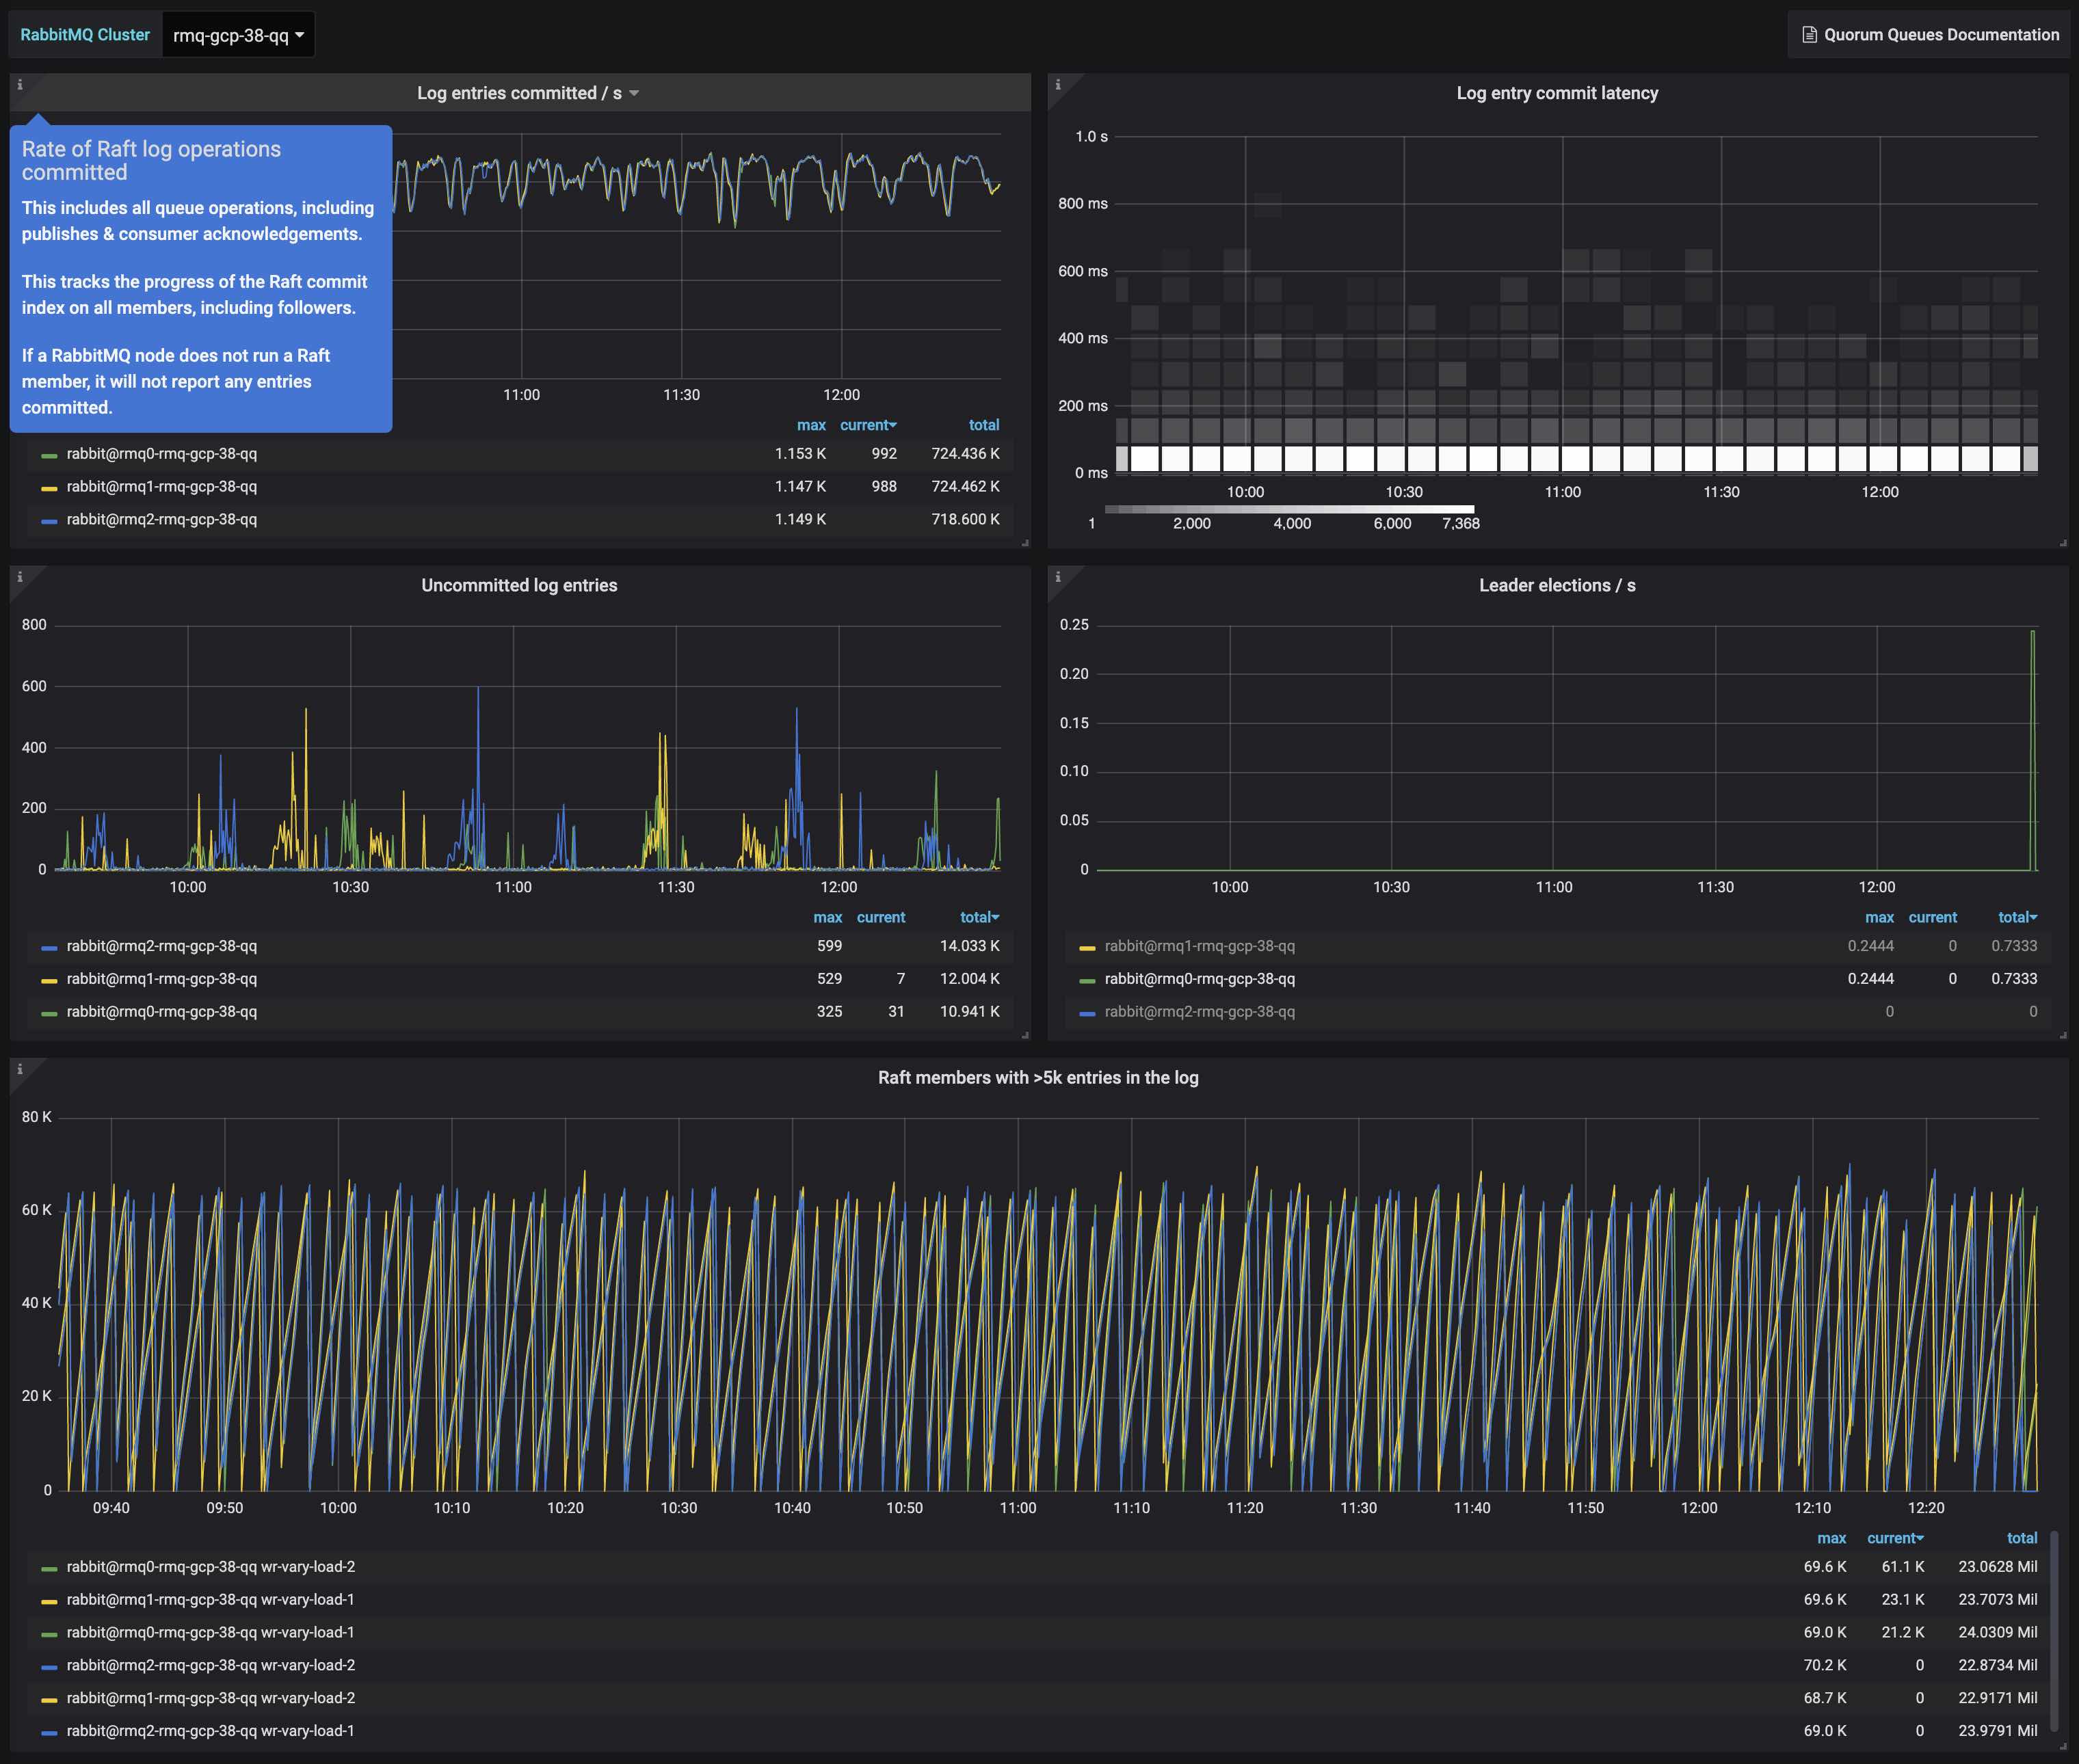
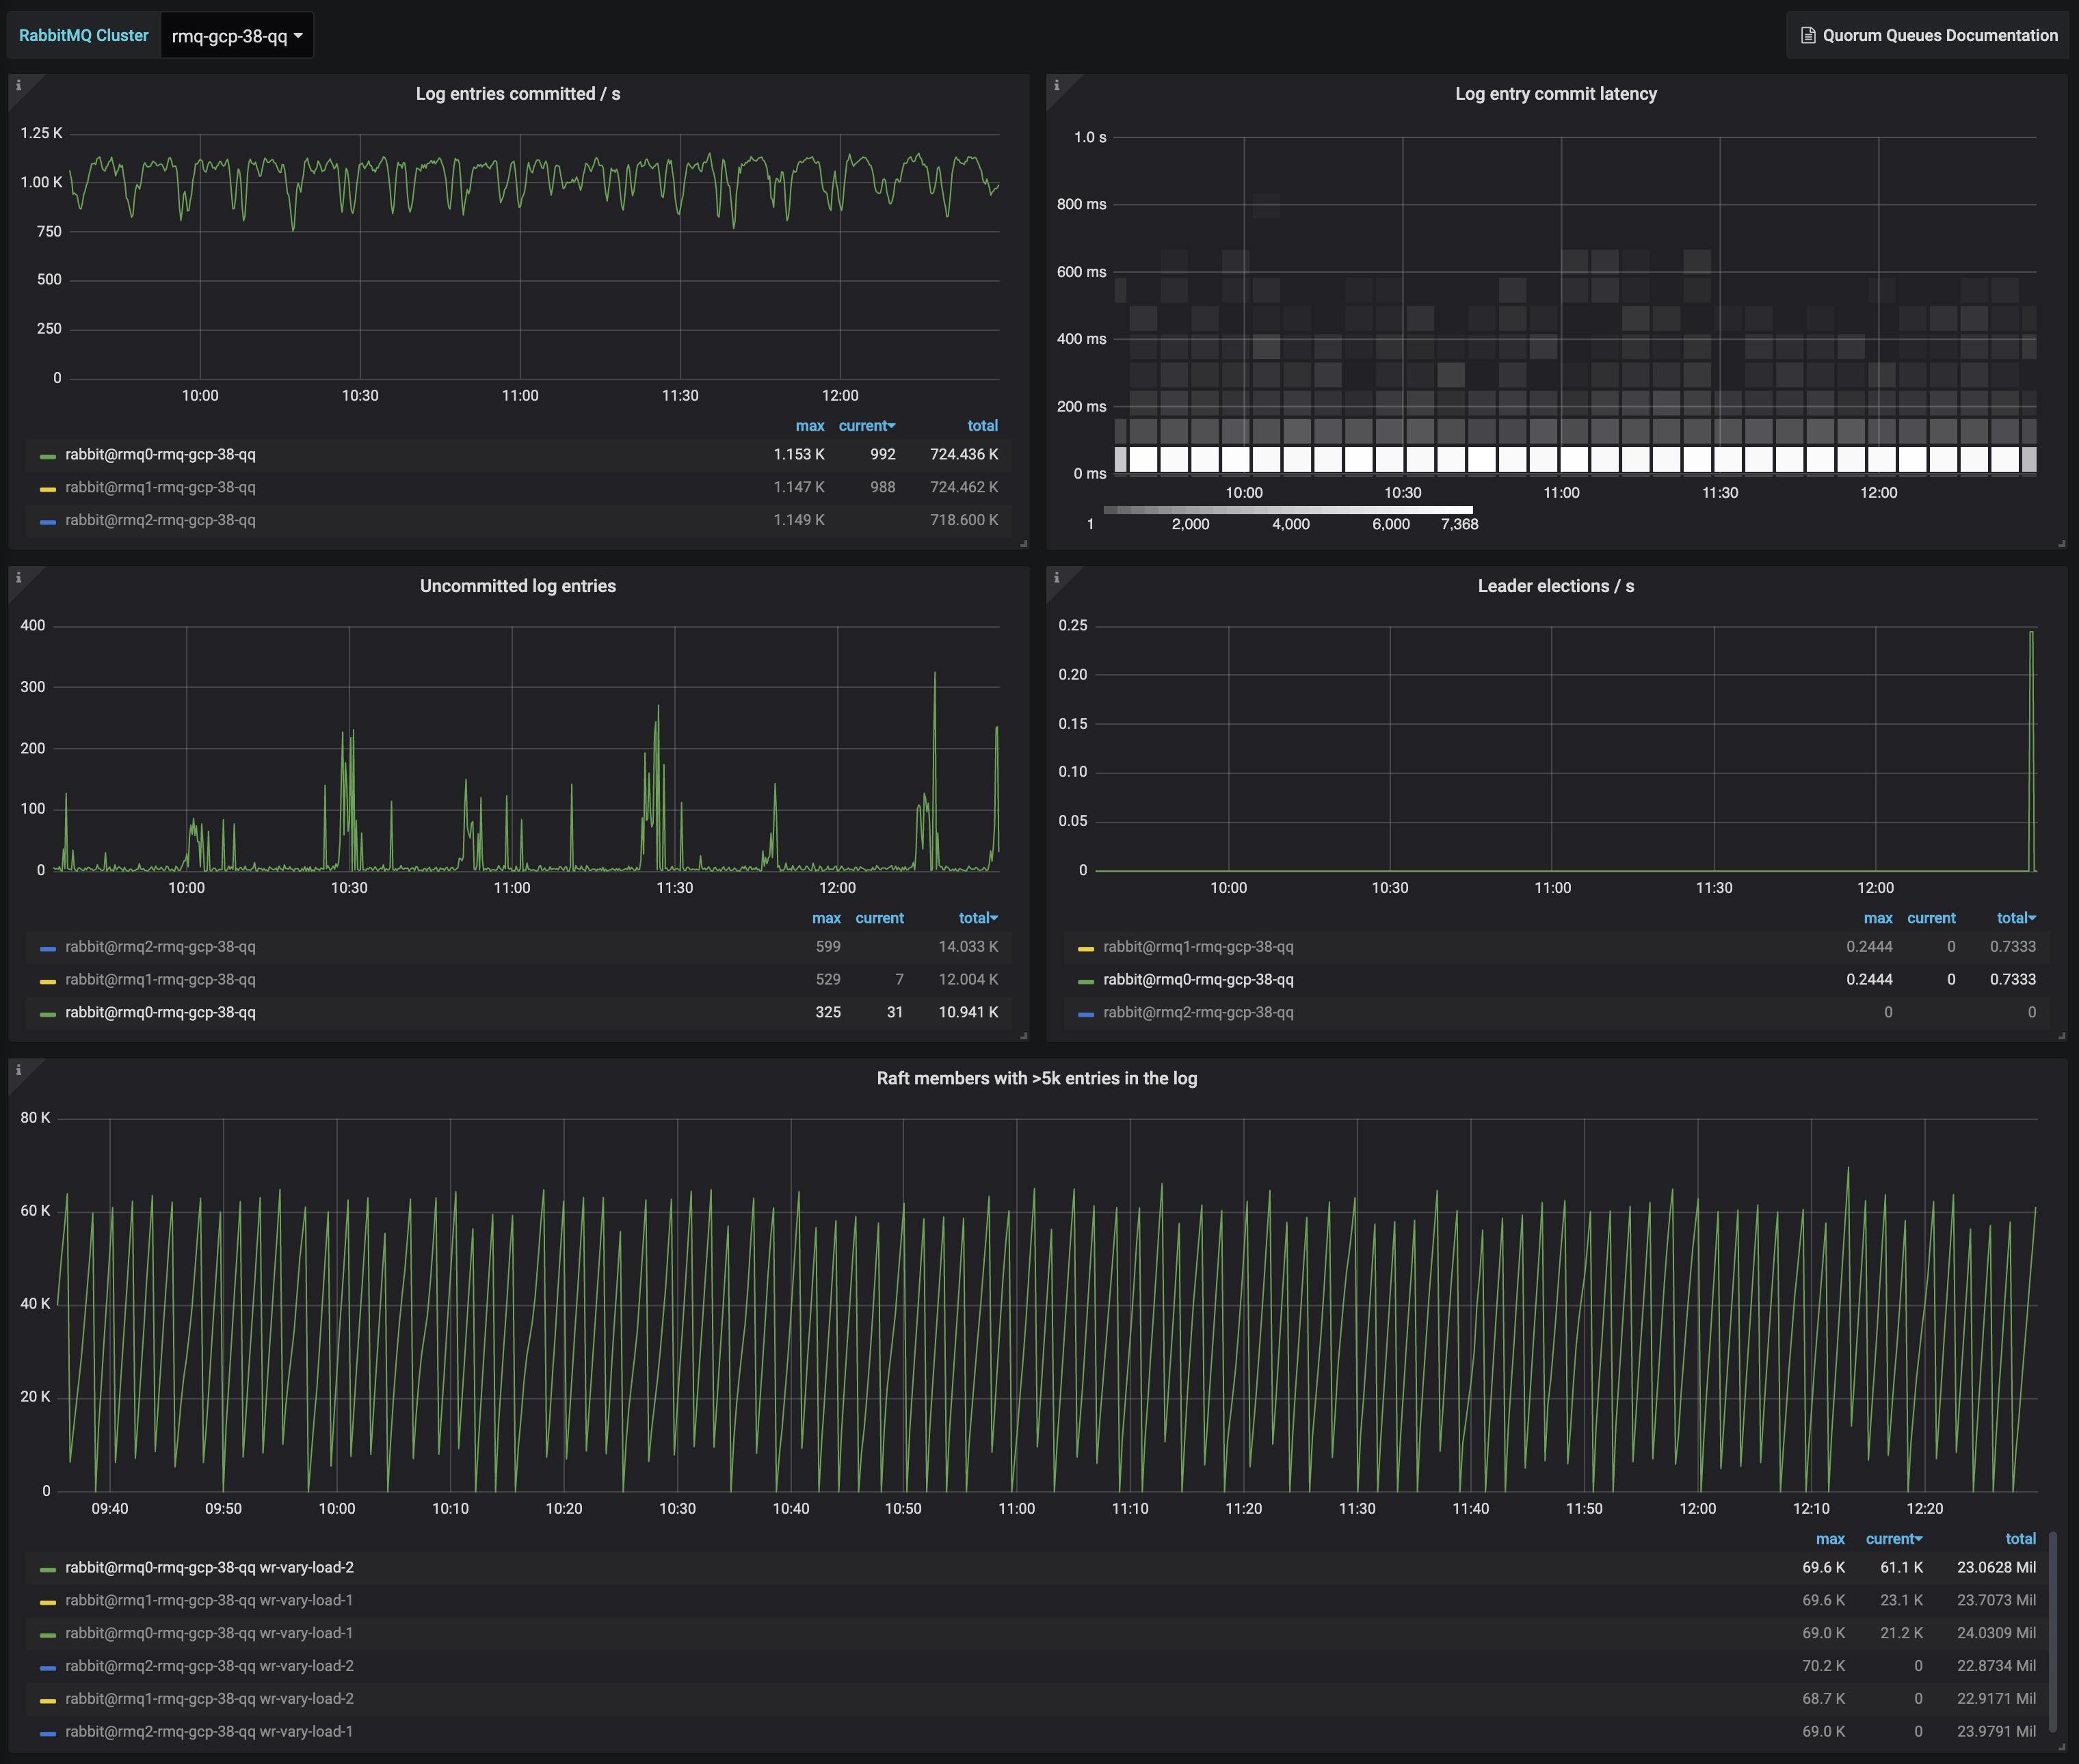
This dashboard monitors the health and progress of RabbitMQ Raft-based quorum queues, focusing on log replication, commitment latency, and leader dynamics. It visualizes per-queue and cluster-wide raft state (commit indices, last written indices, and term changes), unacknowledged entries, and leadership activity, with an emphasis on long-running logs and raft membership behavior to detect replication bottlenecks or election events.
Screenshots
Used Metrics 1111
rabbitmq_cluster
rabbitmq_identity_info
rabbitmq_node
rabbitmq_raft_commit_index
rabbitmq_raft_commit_latency_seconds
rabbitmq_raft_last_written_index
rabbitmq_raft_log_commit_index
rabbitmq_raft_log_last_written_index
rabbitmq_raft_log_snapshot_index
rabbitmq_raft_snapshot_index
rabbitmq_raft_term
Get Dashboard✕
Download
Copy to Clipboard