Redis Dashboard for Prometheus Redis Exporter 1.x 337,366337,366 5.0 (1 reviews)
Description
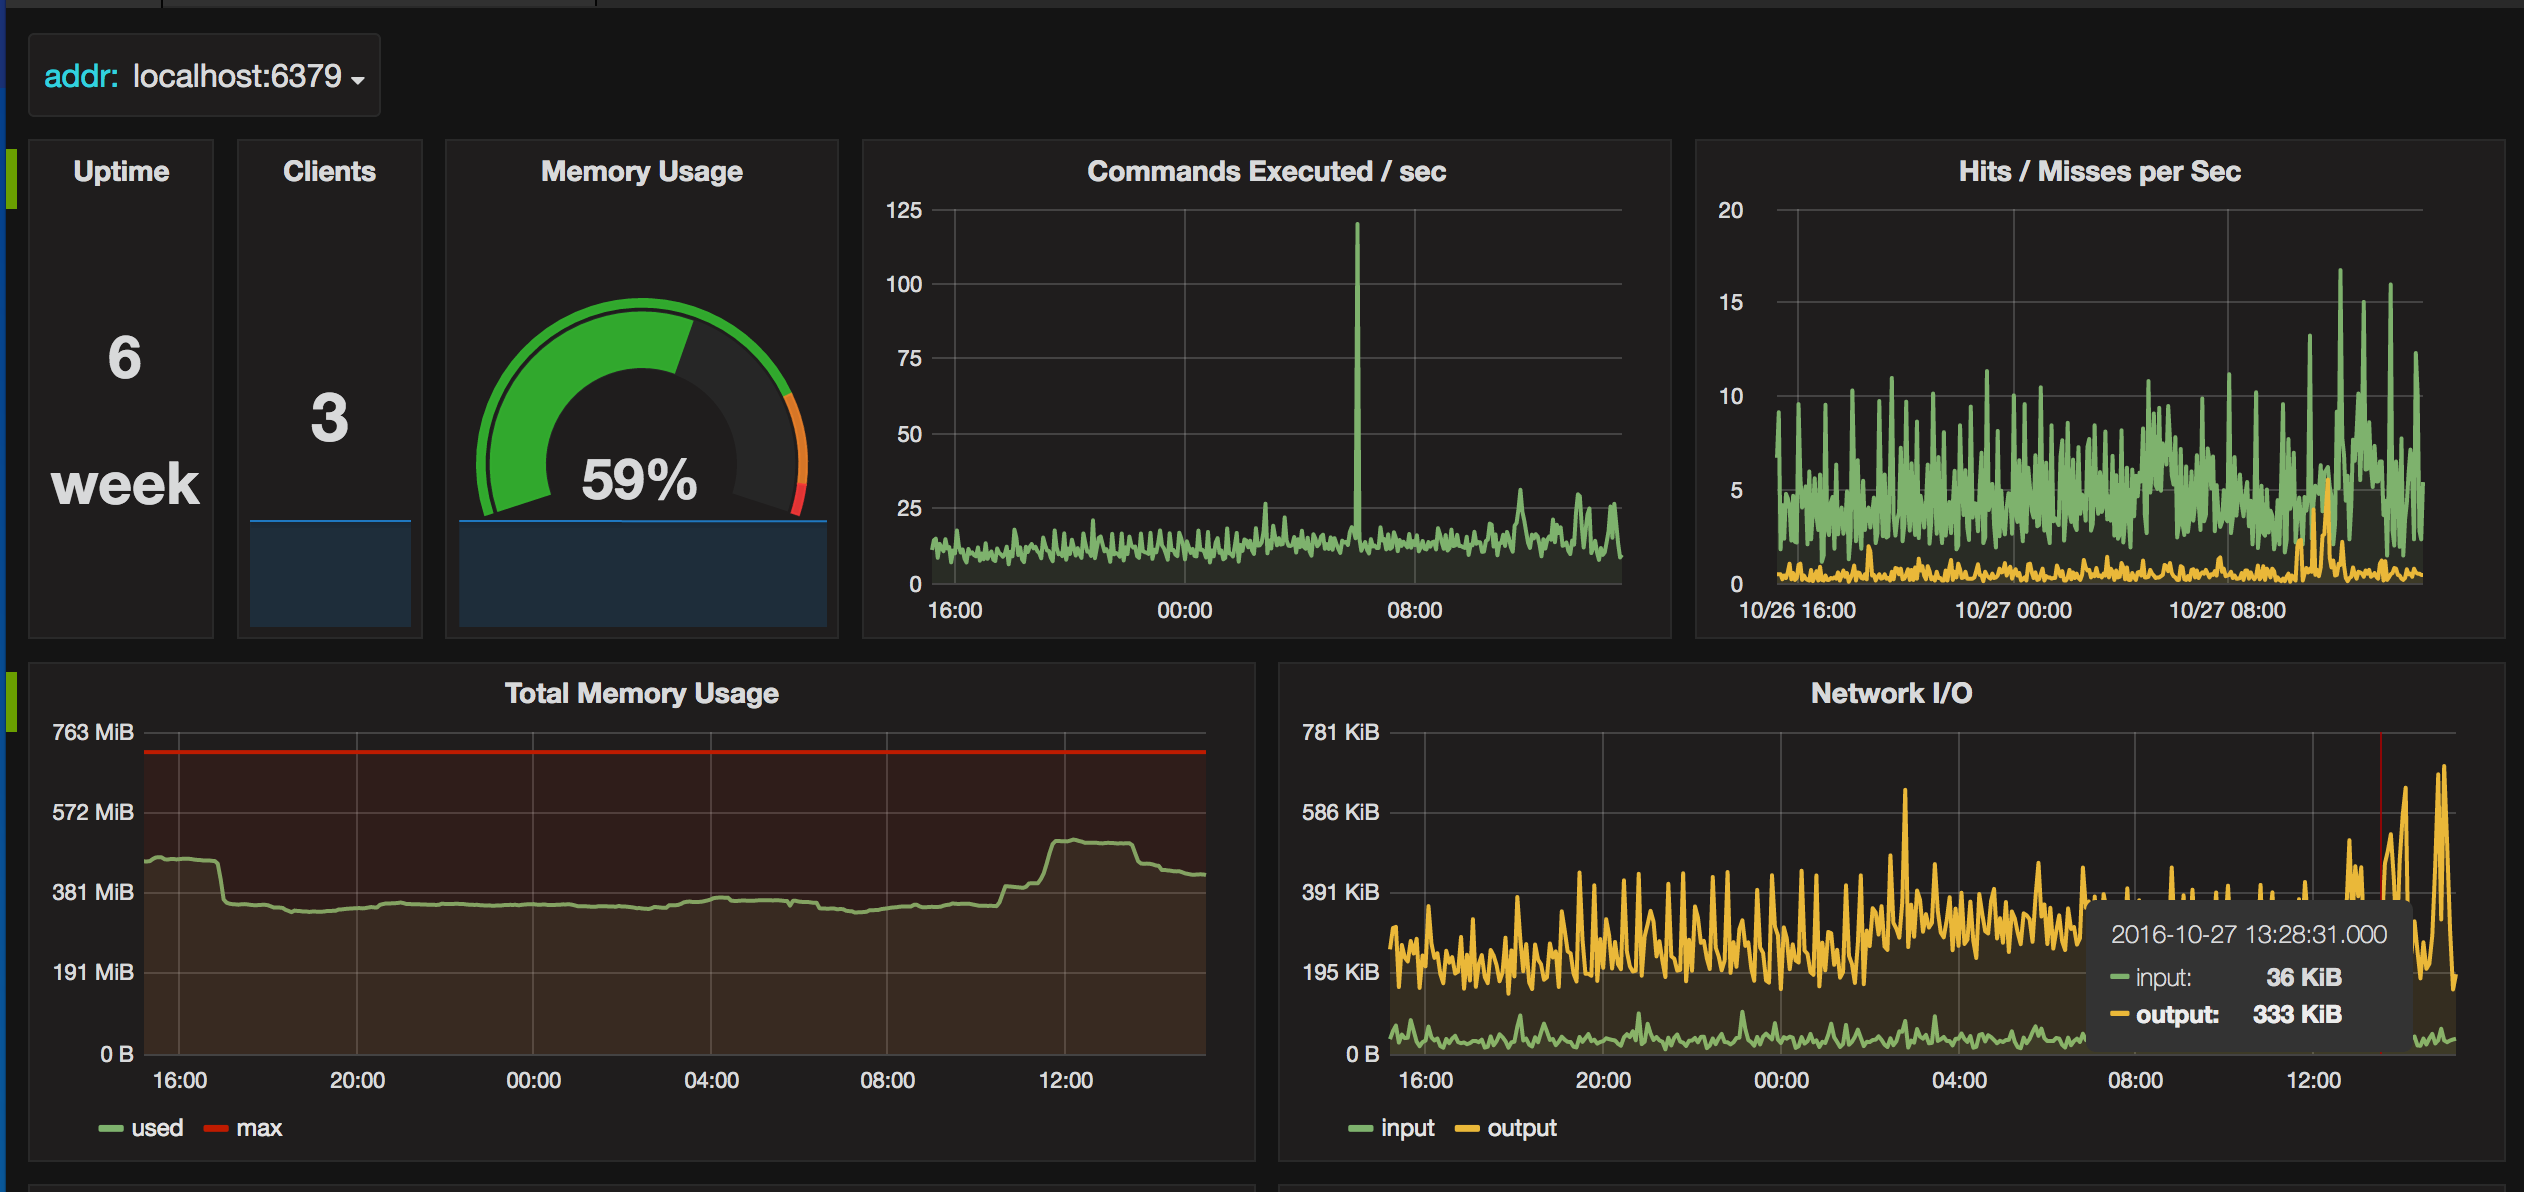
This dashboard monitors Redis performance and health by visualizing core metrics from the Redis Exporter for Prometheus. It emphasizes resource usage, request efficiency, and database key activity, with panels like Memory Usage and Total Commands / sec alongside Hits / Misses per Sec to gauge cache effectiveness. It highlights metrics such as redis_memory_used_bytes, redis_commands_total, and redis_keyspace_hits_total to show memory consumption, throughput, and cache hit behavior.
Screenshots
Used Metrics 1515
-
redis_blocked_clients
-
redis_commands_duration_seconds_total
-
redis_commands_total
-
redis_connected_clients
-
redis_db_keys
-
redis_db_keys_expiring
-
redis_evicted_keys_total
-
redis_expired_keys_total
-
redis_keyspace_hits_total
-
redis_keyspace_misses_total
-
redis_memory_max_bytes
-
redis_memory_used_bytes
-
redis_net_input_bytes_total
-
redis_net_output_bytes_total
-
redis_uptime_in_seconds