Redis Dashboard for Prometheus Redis Exporter (helm stable/redis-ha) 28,020,92828,020,928 5.0 (2 reviews)
3/2/2020
3/2/2020
1
>=6.5.2
Prometheus
Description
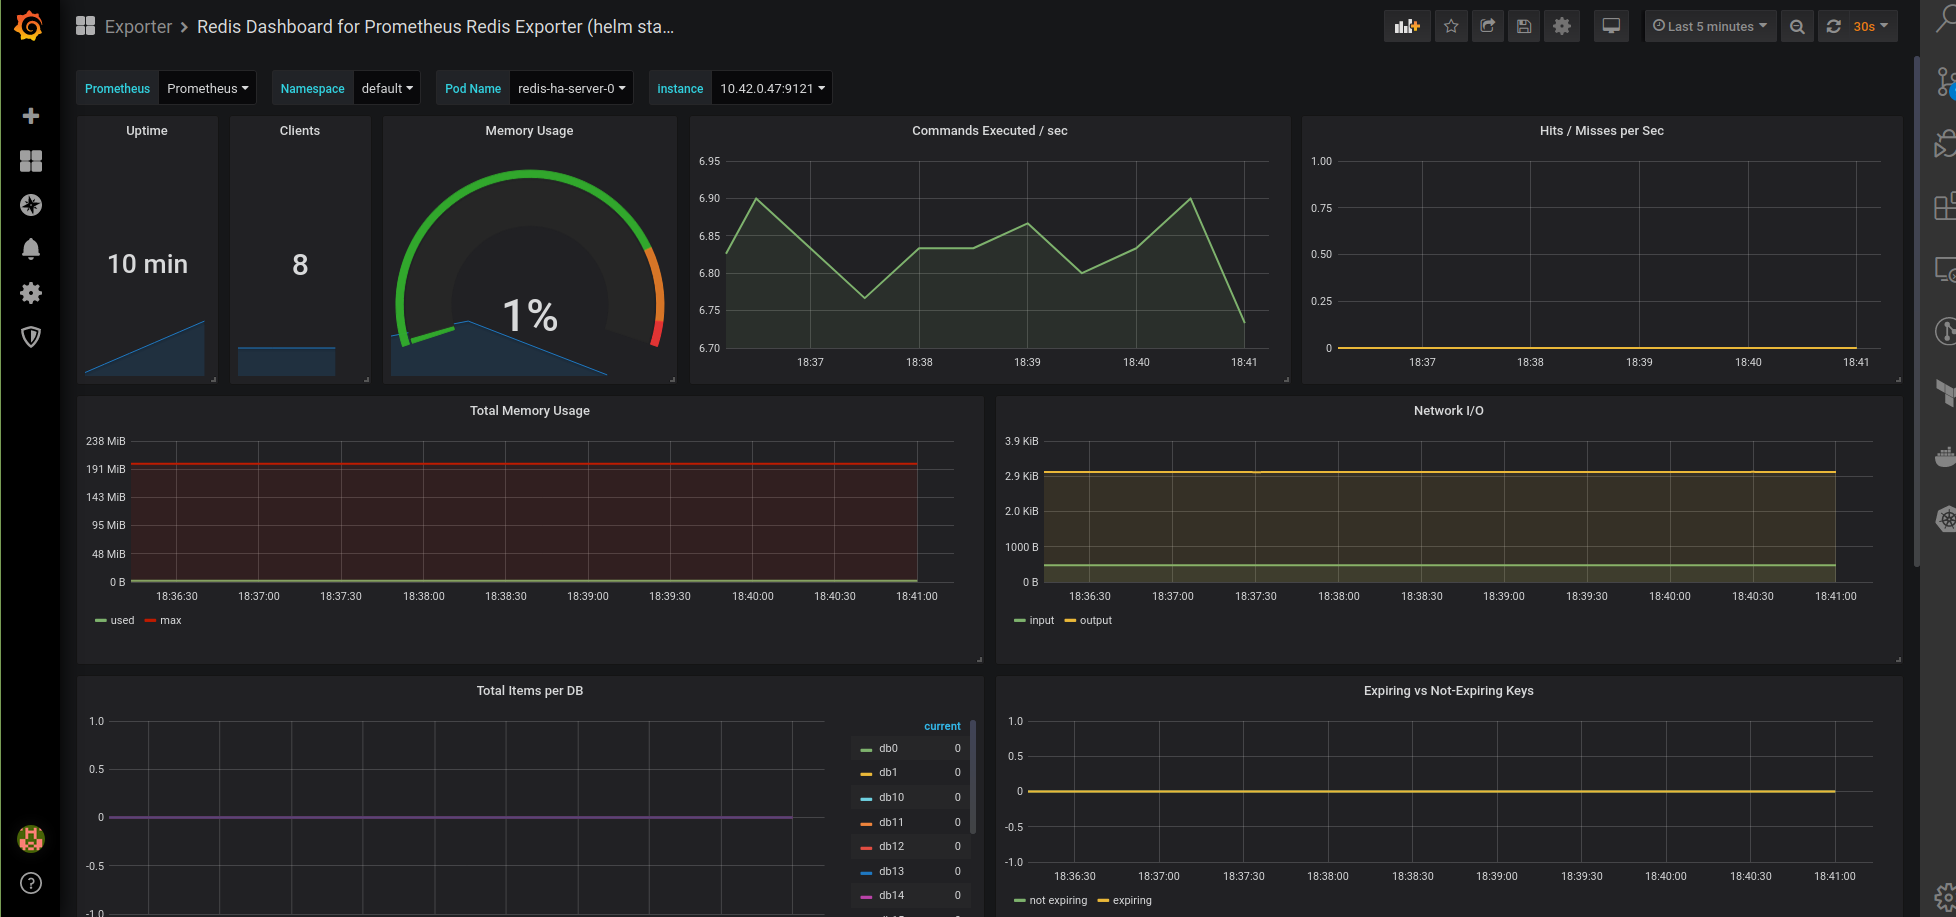
This dashboard provides a consolidated view of a Redis instance managed by Prometheus Redis Exporter, focusing on health, capacity, and throughput. It surfaces uptime, client connections, memory footprint and limits, command throughput, cache hit/mmiss dynamics, and network I/O, with per-DB item counts and key expiration behavior to help diagnose performance, capacity, and eviction risks.
Screenshots
Used Metrics 1515
-
redis_commands_processed_total
-
redis_commands_total
-
redis_connected_clients
-
redis_db_keys
-
redis_db_keys_expiring
-
redis_evicted_keys_total
-
redis_expired_keys_total
-
redis_keyspace_hits_total
-
redis_keyspace_misses_total
-
redis_memory_max_bytes
-
redis_memory_used_bytes
-
redis_net_input_bytes_total
-
redis_net_output_bytes_total
-
redis_uptime_in_seconds
topk
Get Dashboard✕
Download
Copy to Clipboard