Redis Exporter Quickstart and Dashboard 268,038268,038
Description
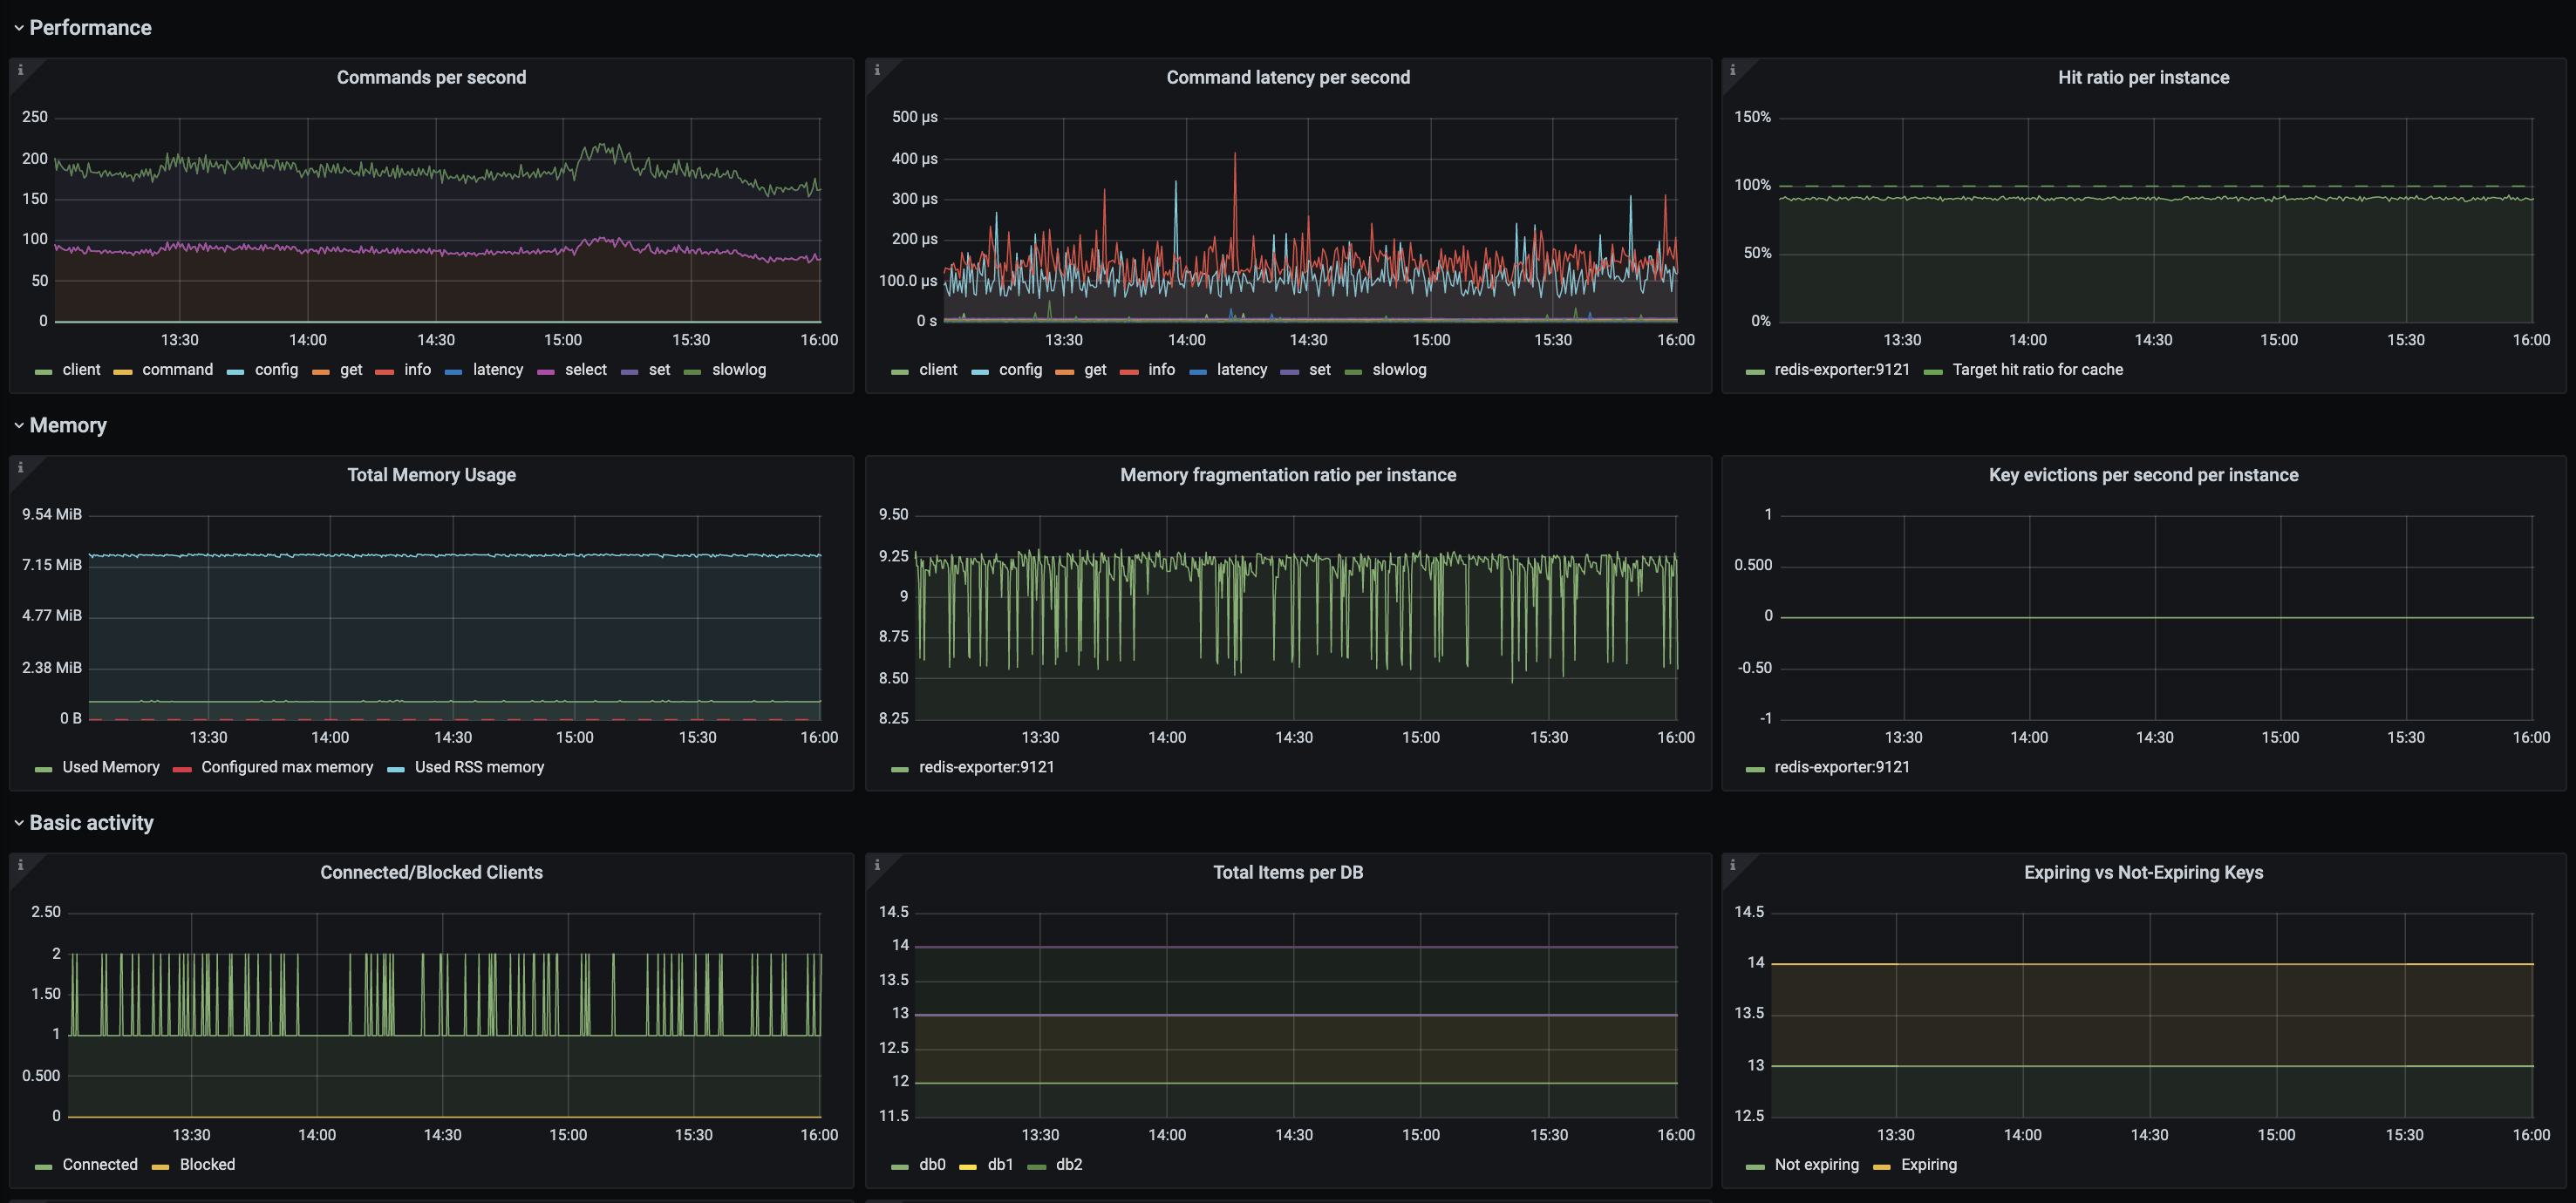
This dashboard monitors Redis performance and health by visualizing command throughput, latency, and memory usage across instances. It highlights operational metrics such as redis_commands_total and redis_commands_duration_seconds_total to track requests per second and latency, memory footprint with redis_memory_used_bytes and redis_memory_fragmentation_ratio, and cache efficacy through redis_keyspace_hits_total vs redis_keyspace_misses_total and evictions. Additional panels provide per-instance views on memory pressure, client connections, and master/slave status to help identify bottlenecks and configuration issues.
Screenshots
Used Metrics 1515
-
redis_blocked_clients
-
redis_commands_duration_seconds_total
-
redis_commands_total
-
redis_connected_clients
-
redis_connected_slaves
-
redis_db_keys
-
redis_db_keys_expiring
-
redis_evicted_keys_total
-
redis_keyspace_hits_total
-
redis_keyspace_misses_total
redis_master_last_io_seconds_ago
redis_memory_fragmentation_ratio
-
redis_memory_max_bytes
-
redis_memory_used_bytes
-
redis_memory_used_rss_bytes