Rocket.Chat Metrics 929929
Description
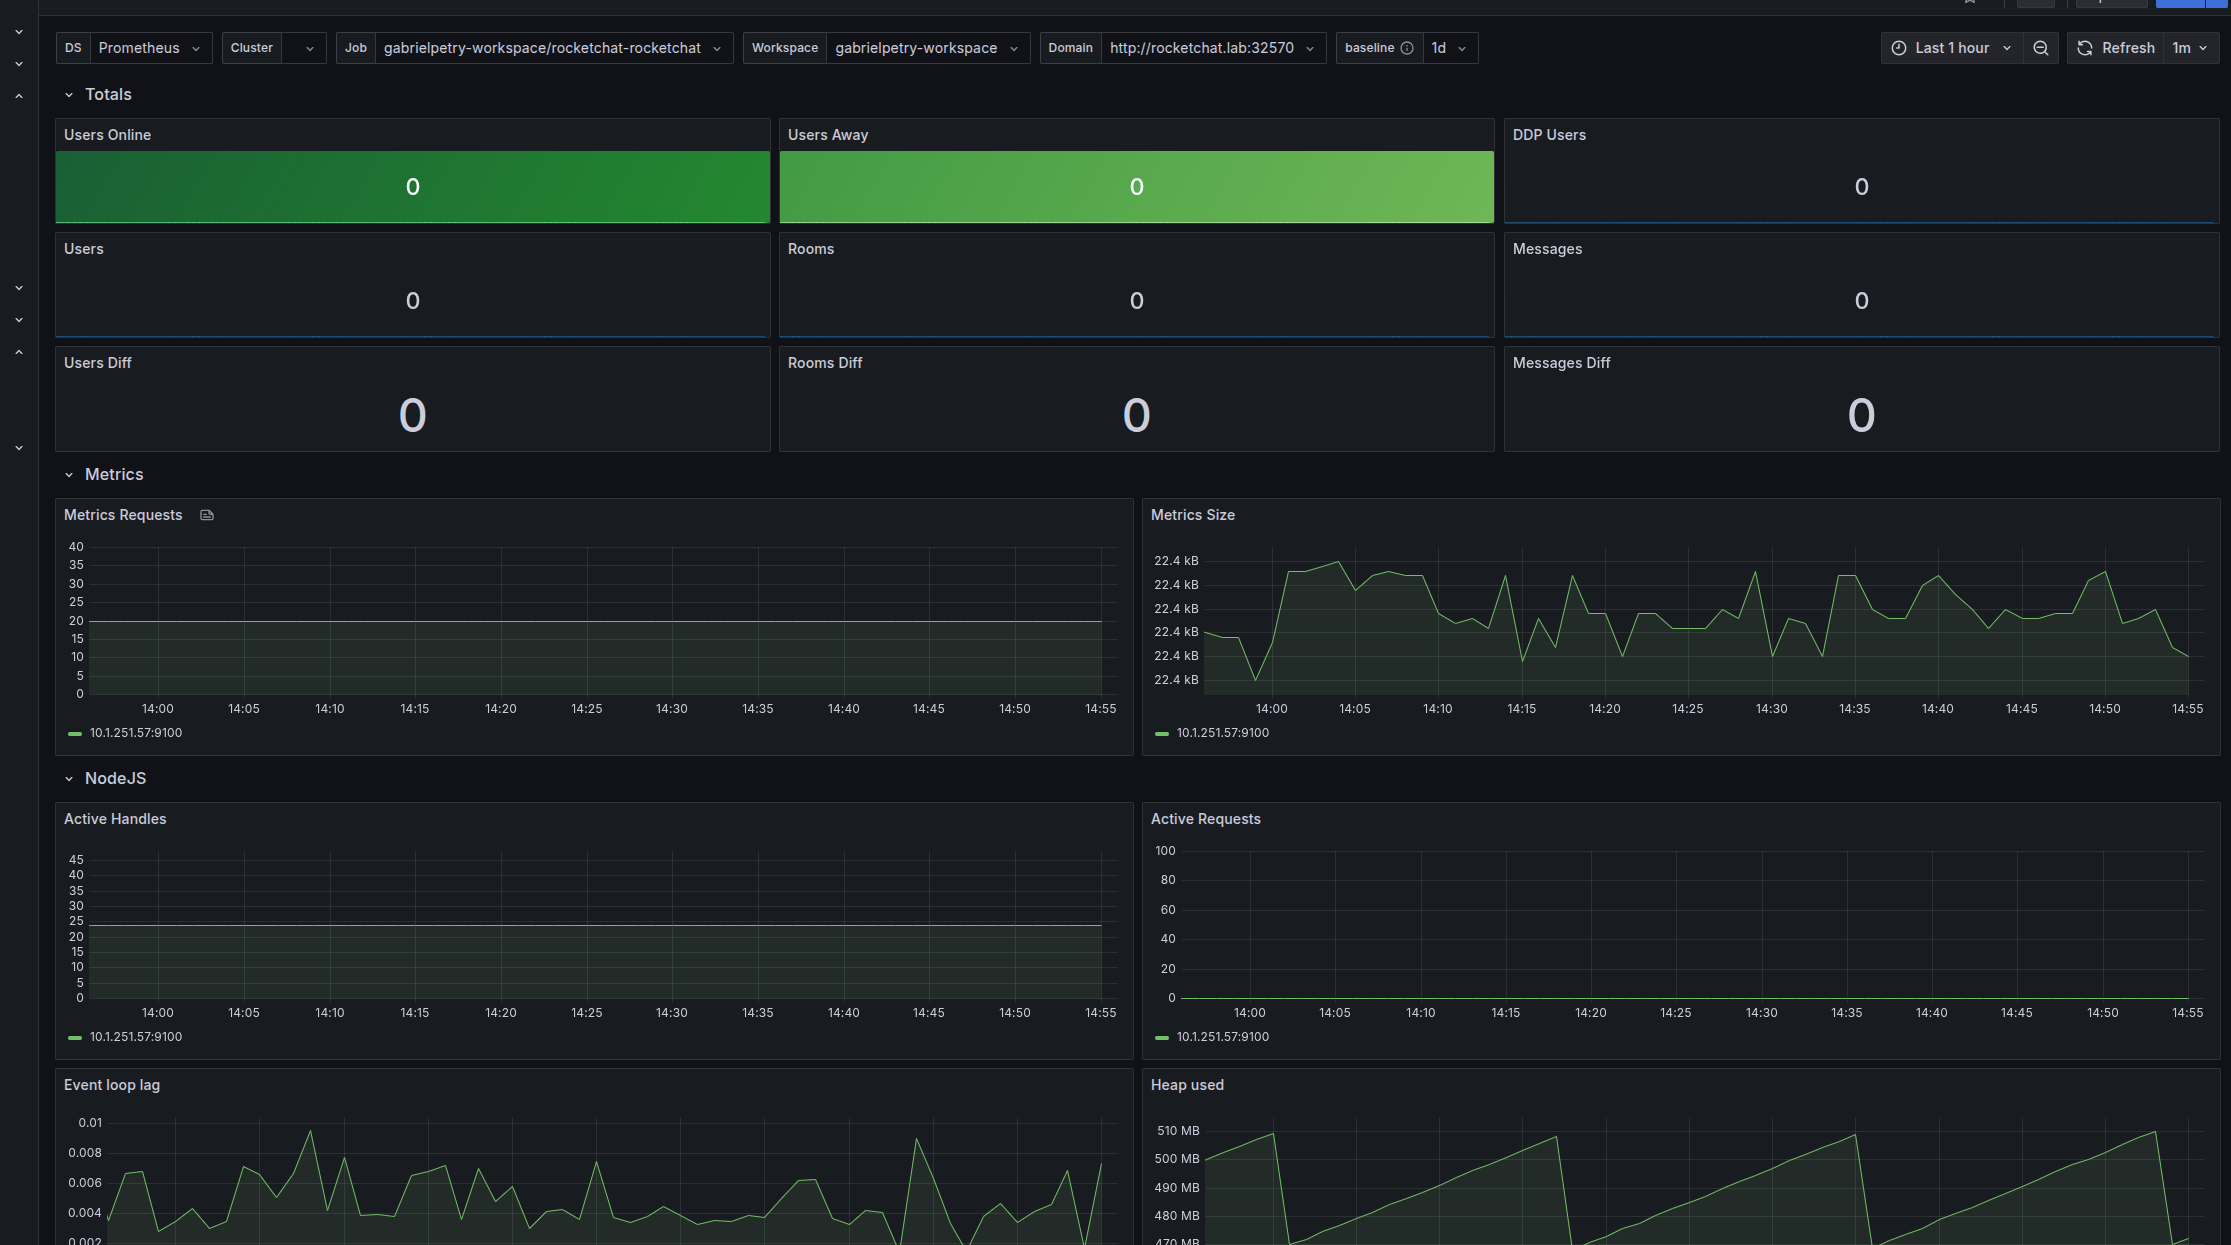
A comprehensive dashboard showing the behavior and performance of your Rocket.Chat application alongside current overall usage statistics. This dashboard provides a holistic view of your Rocket.Chat deployment, helping administrators monitor system health and user activity.
Screenshots
Used Metrics 4444
baseline
-
nodejs_active_handles_total
-
nodejs_active_requests_total
-
nodejs_eventloop_lag_seconds
nodejs_gc_pause_seconds_total
nodejs_gc_reclaimed_bytes_total
-
nodejs_heap_size_used_bytes
rocketchat_apps_enabled
rocketchat_apps_failed
rocketchat_apps_installed
rocketchat_callbacks
rocketchat_callbacks_count
rocketchat_ddp_connected_users
rocketchat_ddp_rate_limit_exceeded
rocketchat_ddp_sessions_auth
rocketchat_ddp_sessions_count
rocketchat_hooks
rocketchat_hooks_count
rocketchat_message_sent
rocketchat_messages_roundtrip_time
rocketchat_messages_roundtrip_time_summary
rocketchat_messages_roundtrip_time_summary_count
rocketchat_messages_roundtrip_time_summary_sum
rocketchat_messages_total
rocketchat_meteor_facts
rocketchat_meteor_methods
rocketchat_meteor_methods_count
rocketchat_meteor_stream
rocketchat_meteor_streamer_broadcast
rocketchat_meteor_subscriptions
rocketchat_meteor_subscriptions_count
rocketchat_metrics_requests
rocketchat_metrics_size
rocketchat_notification_sent
rocketchat_oplog
rocketchat_oplog_queue
rocketchat_push_queue
rocketchat_rest_api
rocketchat_rest_api_count
rocketchat_rooms_total
rocketchat_users_away
rocketchat_users_online
rocketchat_users_total
users_connected