Traefik 2 65,21465,214 5.0 (2 reviews)
Description
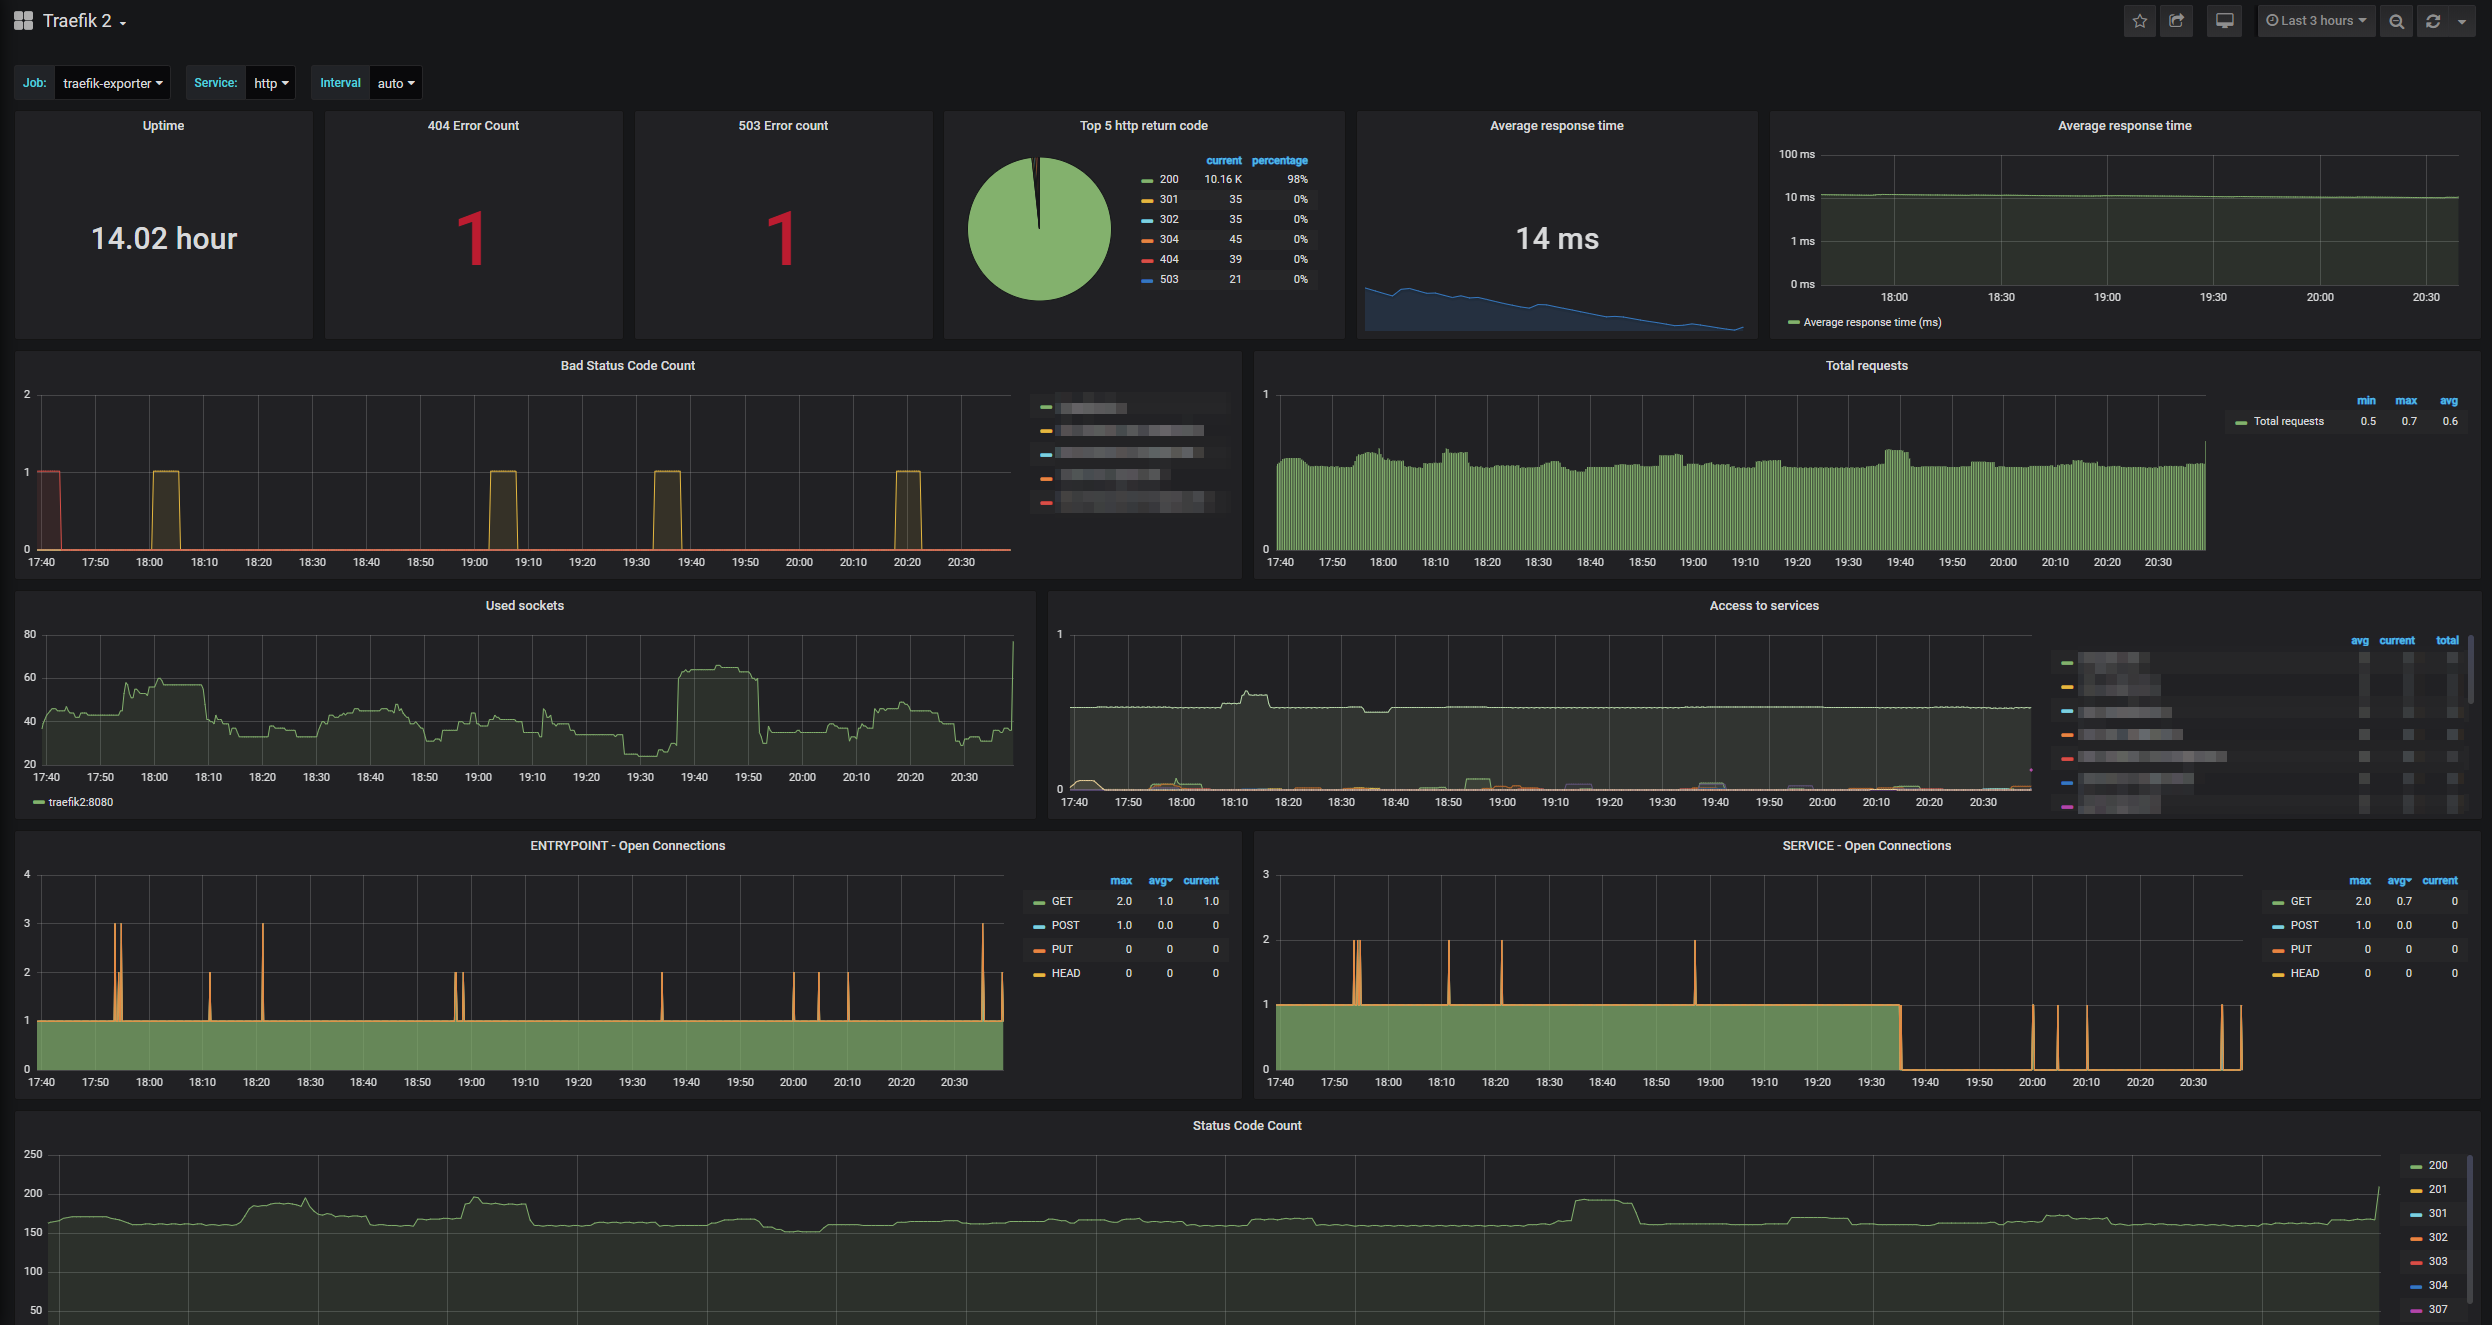
This dashboard monitors Traefik v2 performance and health by visualizing key surfacing metrics such as startup time, request throughput, and error counts. It highlights trends in process_start_time_seconds for uptime, traefik_service_requests_total and traefik_entrypoint_requests_total for traffic, and traefik_service_request_duration_seconds_sum / traefik_entrypoint_request_duration_seconds_sum for latency. Additional panels track error distributions (e.g., 404 and 503 counts), connection/Open Socket metrics (process_open_fds, traefik_entrypoint_open_connections, traefik_service_open_connections), and the overall request volume with panels like Total requests and Status Code Count, providing a comprehensive view of service health and performance.
Screenshots
Used Metrics 1010
interval
-
process_open_fds
-
process_start_time_seconds
topk
traefik_entrypoint_open_connections
traefik_entrypoint_request_duration_seconds_sum
traefik_entrypoint_requests_total
traefik_service_open_connections
traefik_service_request_duration_seconds_sum
traefik_service_requests_total