VolSync Dashboard 69,88269,882
6/18/2024
8/2/2024
3
>=11.1.0
Prometheus
Description
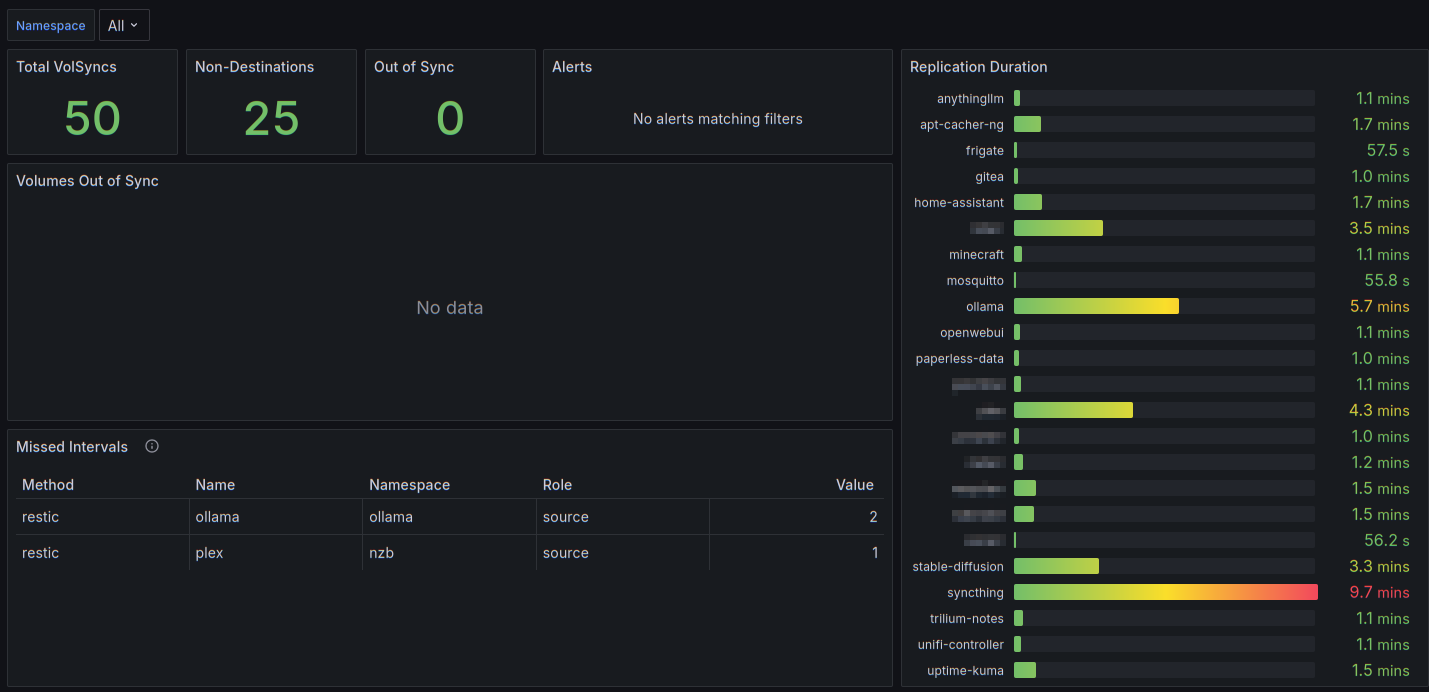
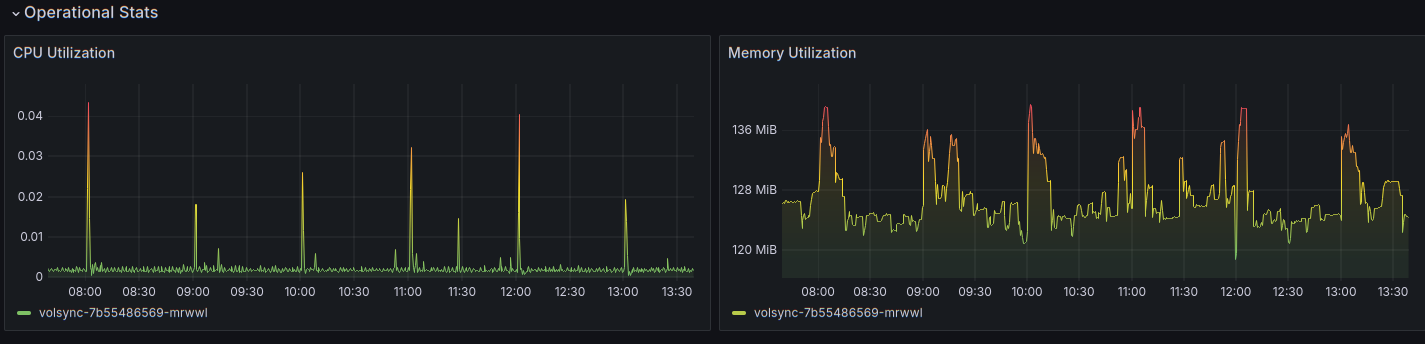
This dashboard monitors the health and synchronization status of VolSync deployments, combining workload state, latency, and resource usage to surface operational risks. Key features include tracking volsync_volume_out_of_sync, volsync_sync_duration_seconds, and volsync_missed_intervals_total to detect lag, stalls, and missed sync cycles, while resource utilization panels surface CPU and memory pressure via metrics like node_namespace_pod_container:container_cpu_usage_seconds_total:sum_irate and container_memory_working_set_bytes.
Screenshots
Used Metrics 55
-
container_memory_working_set_bytes
node_namespace_pod_container:container_cpu_usage_seconds_total:sum_irate
volsync_missed_intervals_total
volsync_sync_duration_seconds
volsync_volume_out_of_sync
Get Dashboard✕
Download
Copy to Clipboard