y0nei's cAdvisor dashboard 221,778221,778
Description
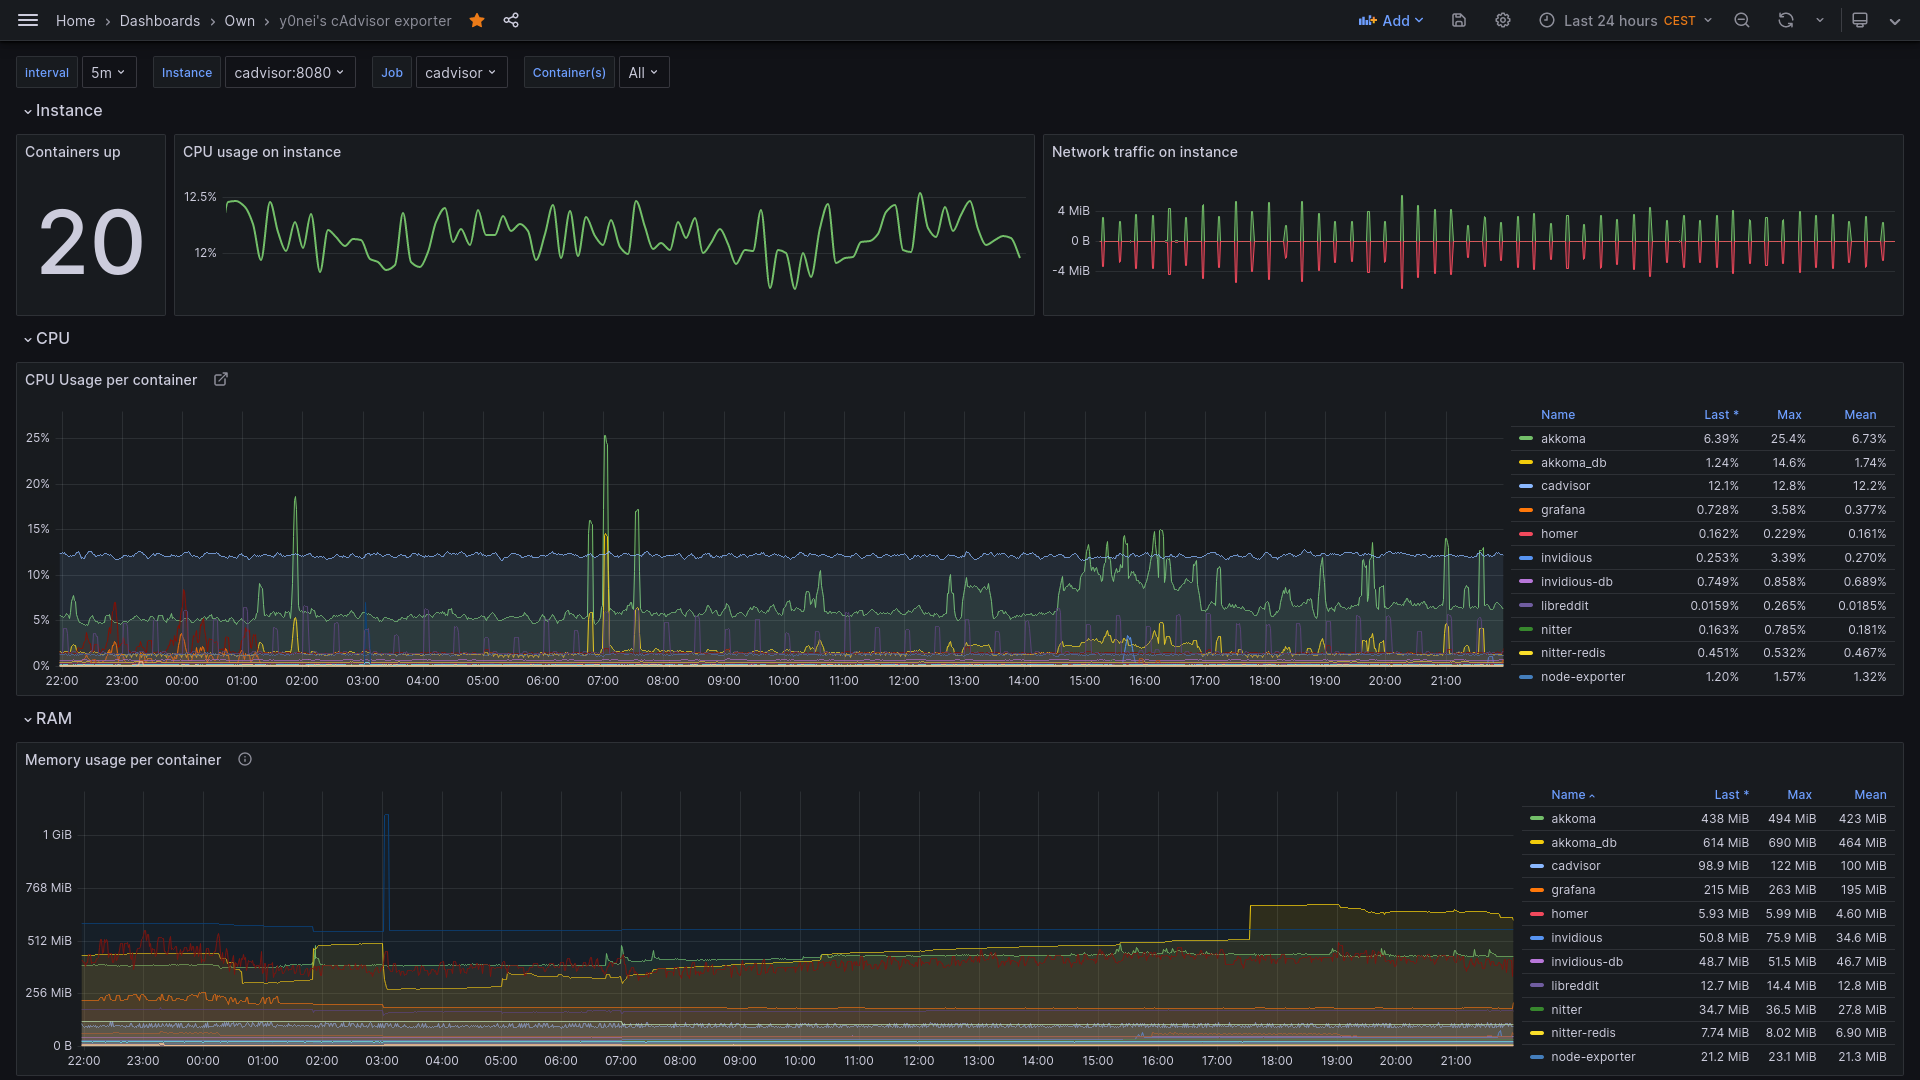
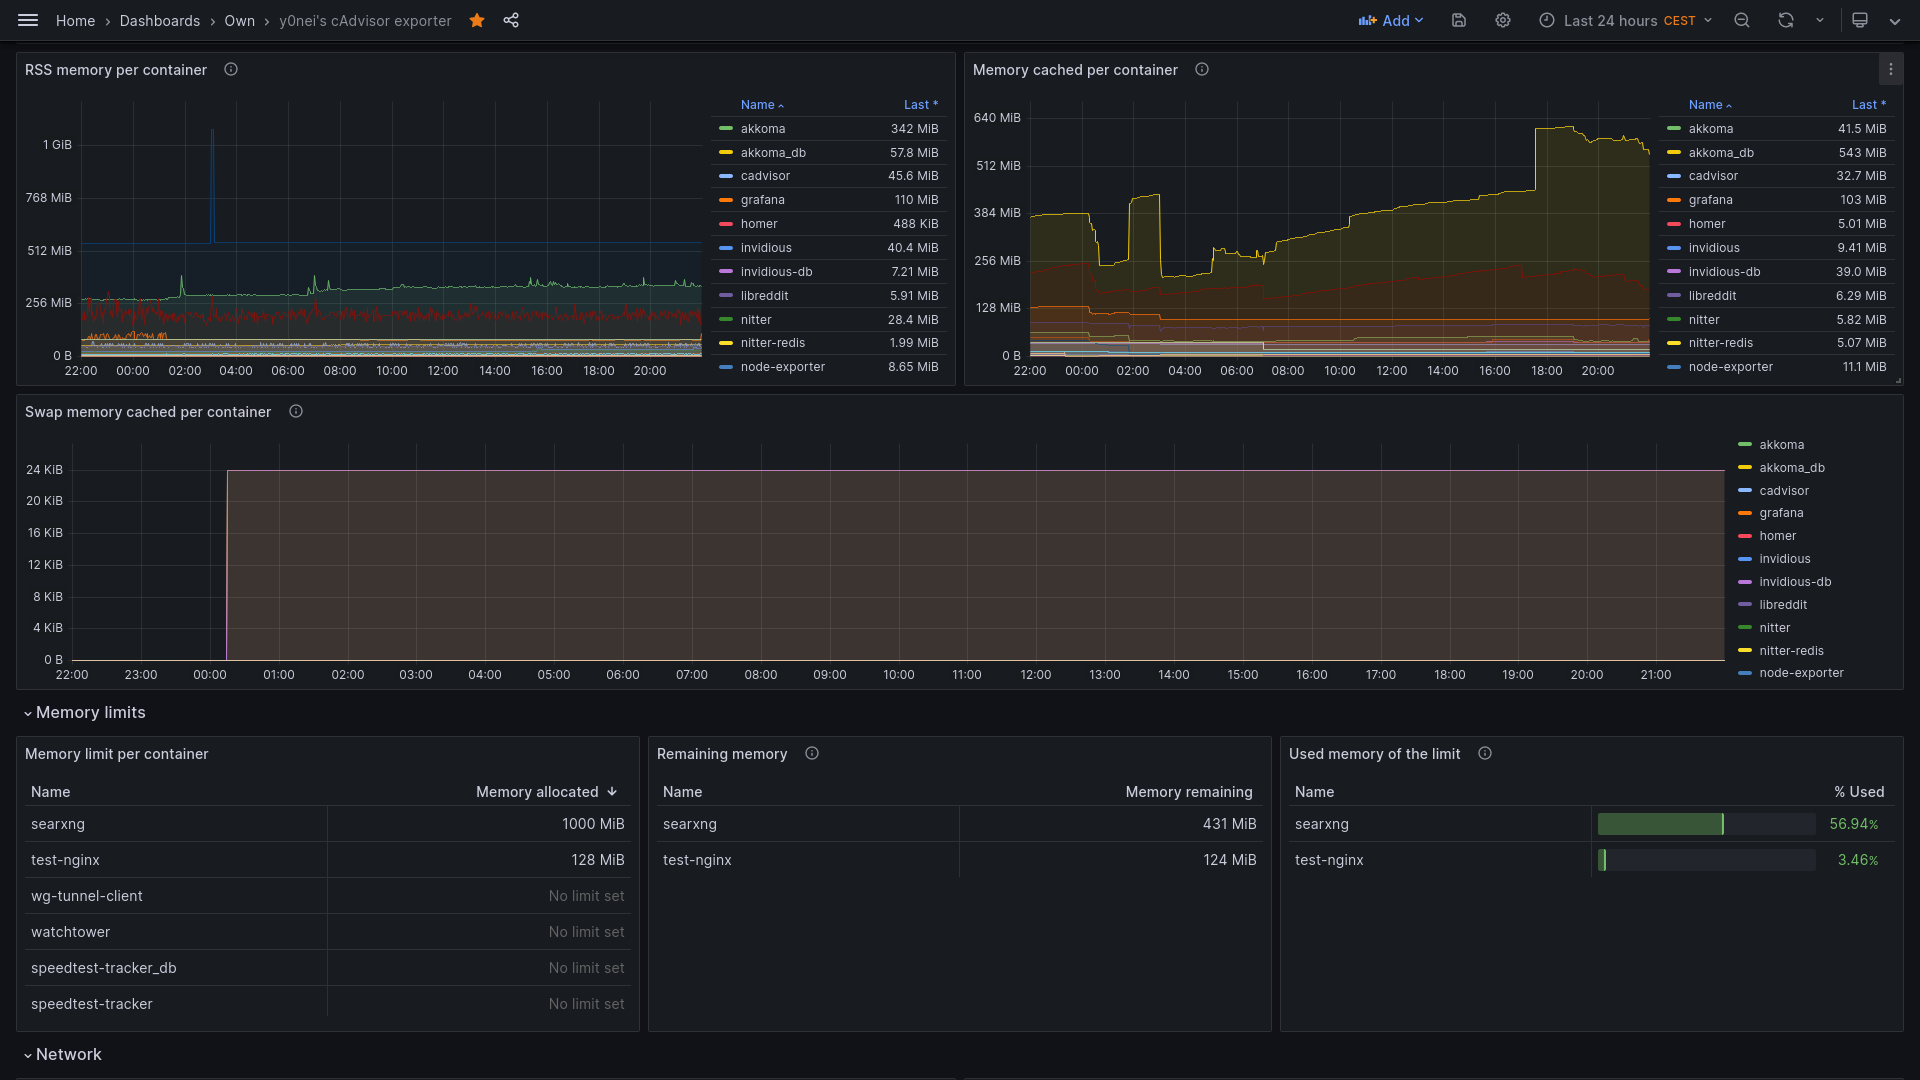
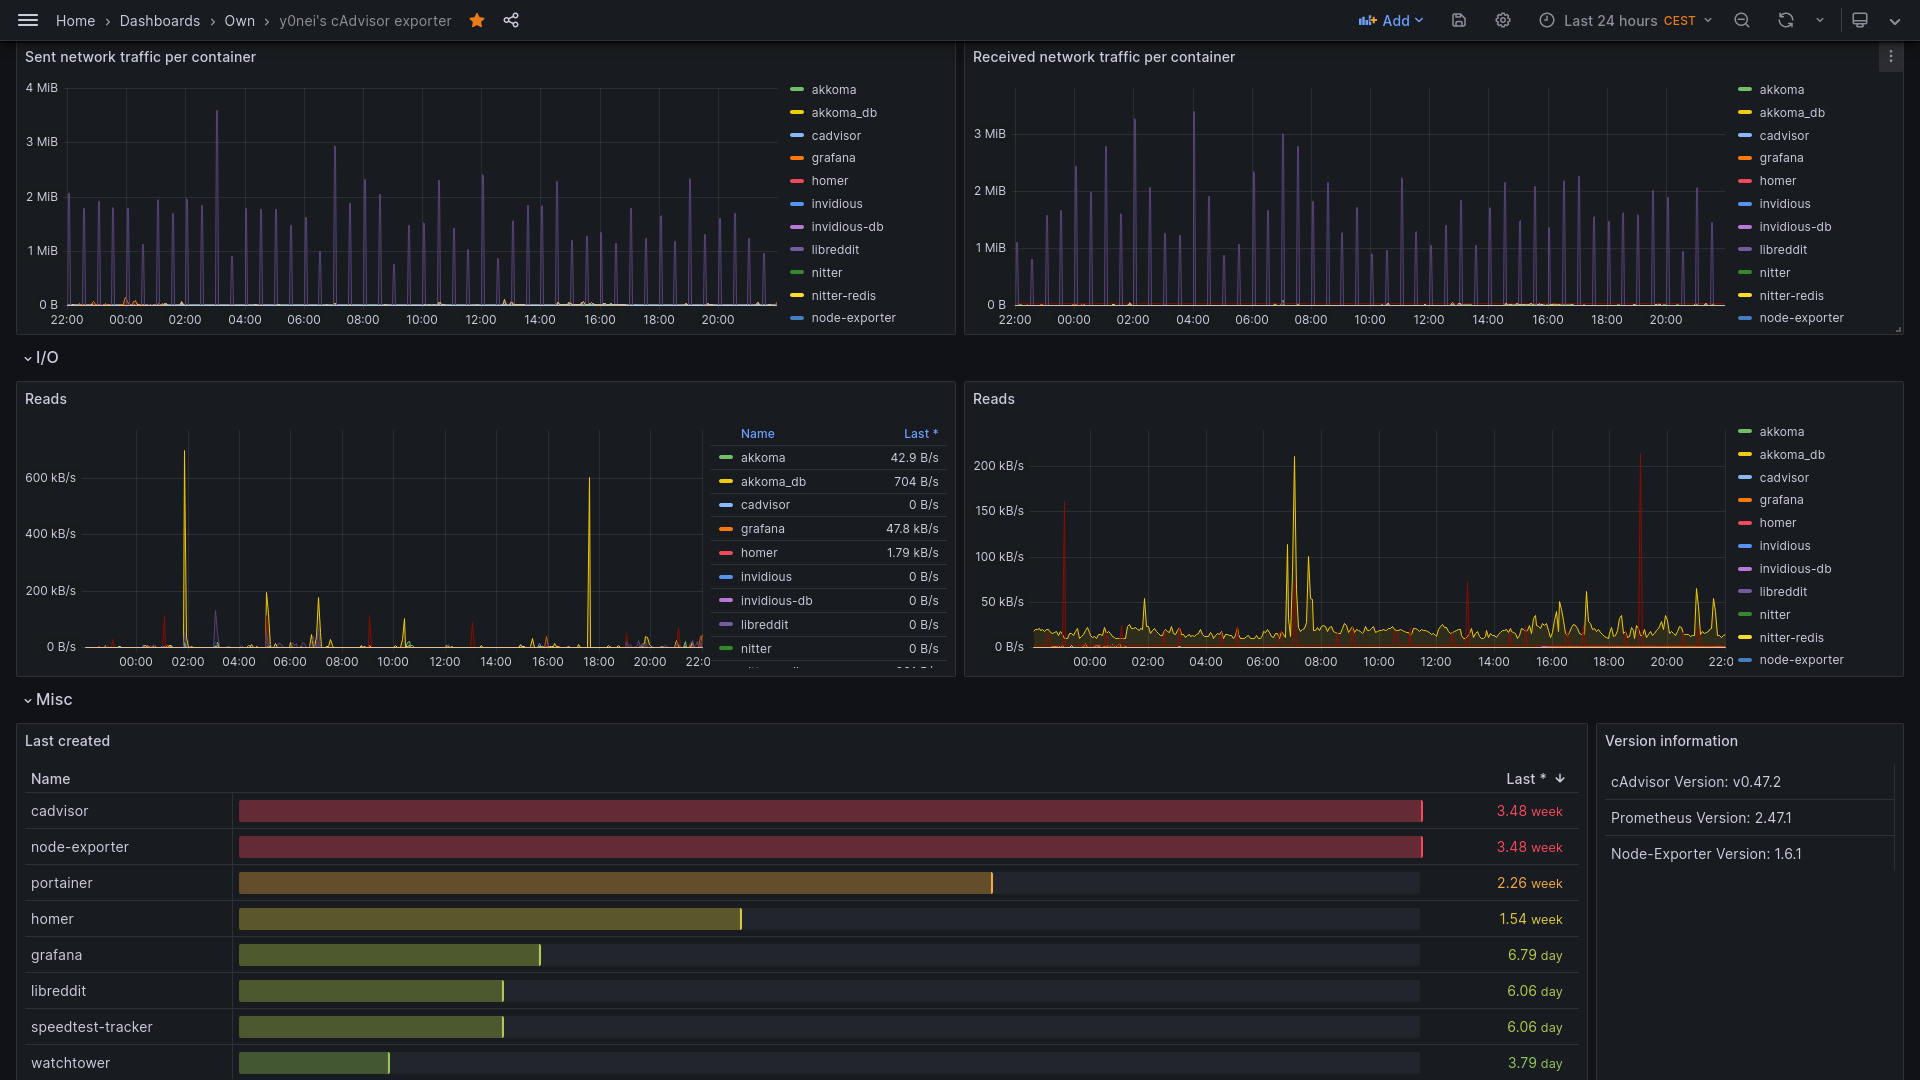
This dashboard monitors container-level and host-level resource usage for a cAdvisor-backed environment, combining time-series metrics to track both per-container and per-instance activity. It highlights key metrics such as container_cpu_usage_seconds_total, container_memory_usage_bytes, and container_network_receive_bytes_total to surface CPU, memory, and network trends, while also exposing derived indicators like Remaining memory and Used memory of the limit for capacity planning.
Screenshots
Used Metrics 1717
-
cadvisor_version_info
-
container_cpu_usage_seconds_total
-
container_fs_reads_bytes_total
-
container_fs_writes_bytes_total
-
container_last_seen
-
container_memory_cache
-
container_memory_rss
-
container_memory_swap
-
container_memory_usage_bytes
-
container_network_receive_bytes_total
-
container_network_transmit_bytes_total
container_spec_memory_limit_bytes
-
container_start_time_seconds
interval
-
node_exporter_build_info
-
process_cpu_seconds_total
-
prometheus_build_info